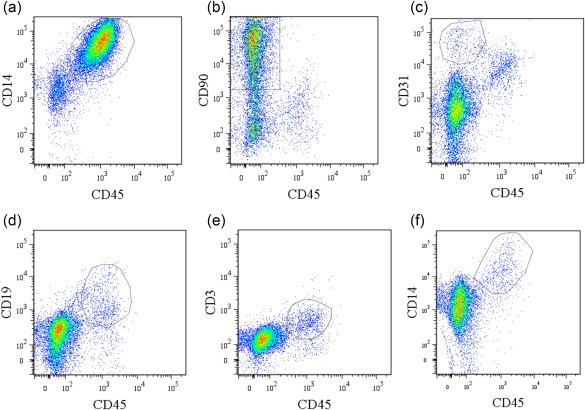
Figure 1.

Flow cytometric analysis of CD14‐negative and ‐positive synovial cells obtained from osteoarthritis patients. (a) Dot‐plot analysis of CD45+CD14+ cells in CD14‐positive fractions. x‐axis, CD45; y‐axis, CD14. (b–f) Dot‐plot analysis of CD14‐negative fractions. x‐axis, CD45; y‐axis, CD90 (b), CD31 (c), CD19 (d), CD3 (e), CD14 (f). Data represent mean ± standard error (s.e.) (n = 5). [Colour figure can be viewed at wileyonlinelibrary.com]
