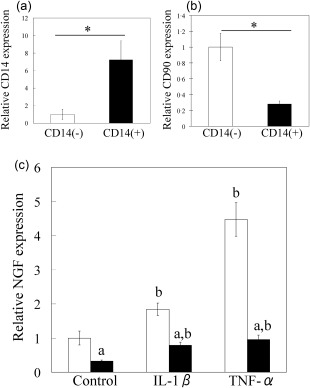
Figure 4.

Effect of tumour necrosis factor (TNF)‐α and interleukin (IL)‐1β on nerve growth factor (NGF) mRNA expression in synovial CD14‐negative and ‐positive fractions in culture. (a,b) Quantitative polymerase chain reaction (qPCR) analysis of CD14 (a) and CD90 (b) mRNA expression in cultured CD14‐negative and ‐positive fractions. (c) qPCR analysis of NGF mRNA expression in cultured synovial cells obtained from the knees of osteoarthritis (OA) patients following the treatment of CD14‐negative (white bars) and ‐positive cells (black bars) with α‐minimum essential culture medium (α‐MEM), 50 ng/ml human recombinant IL‐1β or 10 ng/ml human recombinant TNF‐α. Data represent mean ± standard error (s.e.) (n = 10). aStatistical difference between CD14‐negative and ‐positive cells under the same conditions; bstatistical difference between cytokine‐stimulated and non‐stimulated cells in each fraction.
