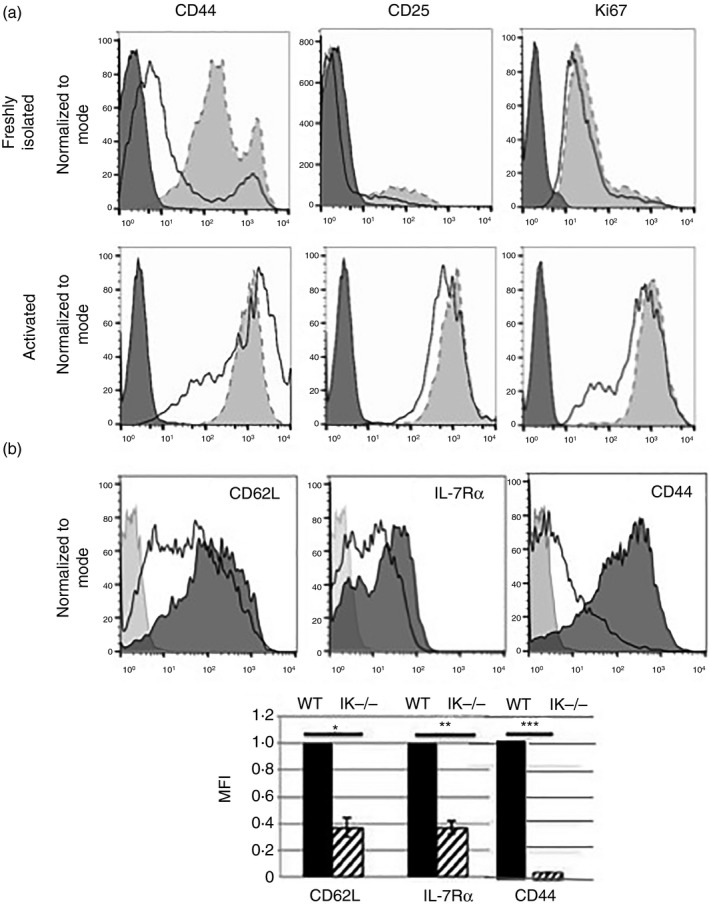
Figure 3.

Ikaros null CD4 T cells do not represent an activated or memory cell population. (a) Flow cytometry analyses of CD44, CD25 and Ki67 expression in purified wild‐type (shaded histograms) and Ikaros null (black outlined histograms) freshly isolated and activated CD4 T cells. Data are representative of two independent experiments. (b) Flow cytometric analyses of CD62L, interleukin‐7 receptor α (IL‐7Rα) and CD44 expression in wild‐type (shaded histogram) and Ikaros null (black outlined histogram) CD4 single‐positive T cells in the thymus. Bar graph is representative of mean fluorescence intensities compiled from three independent experiments (*P = 0·00547, **P = 0·0028, ***P = 3·75 × 10−4). Error bars are representative of ± SEM.
