Figure 4.

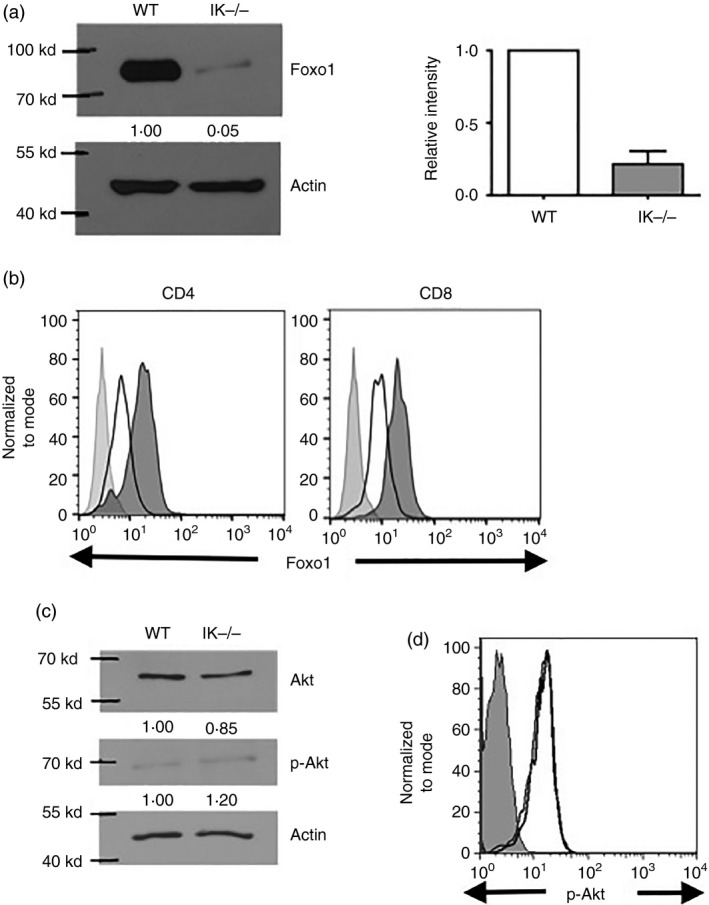
In the absence of Ikaros, decreased levels of Foxo1 protein are observed in T cells. (a) Western blot analysis of Foxo1 expression in purified splenic CD4+ T cells from wild‐type and Ikaros null (IK −/−) mice. Intensity of bands for Foxo1, normalized to actin bands, is shown as fold over wild‐type levels below each band. Average of relative intensity of Foxo1 in Ikaros null compared with wild‐type T cells over three independent experiments are compiled in bar graph. (b) Levels of Foxo1 in CD4 and CD8 T cells in wild‐type (shaded histogram) and Ikaros null (black outlined histogram) spleens as determined by intracellular staining followed by flow cytometric analyses. Data are representative of two independent experiments. (c) Akt and phospho‐Akt (p‐Akt) expression levels were analysed by Western blot using whole‐cell lysates prepared from purified splenic CD4 T cells from wild‐type and Ikaros null (IK −/−) mice. The intensity of the bands for Akt and p‐Akt are normalized to actin and shown as fold over wild‐type levels below each image. Data are representative of two independent experiments. (d) Levels of anti‐phospho‐Akt in CD4 T cells in wild‐type (black line) and Ikaros null (light grey line) spleens as determined by intracellular staining followed by flow cytometric analyses. Error bars are representative of ± SEM. Data are representative of two independent experiments.
