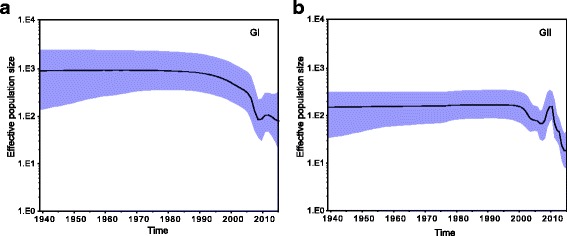
Fig. 4.

Bayesian skyline plots of NoV in China estimated from GI (a) and GII (b) VP1 sequences. The plots illustrate the relative effective population size (genetic diversity) of GI and GII NoVs through time. The solid black line represents the mean posterior value and the blue area corresponds to the 95% highest probability density (HPD) intervals
