
Fig. 3.
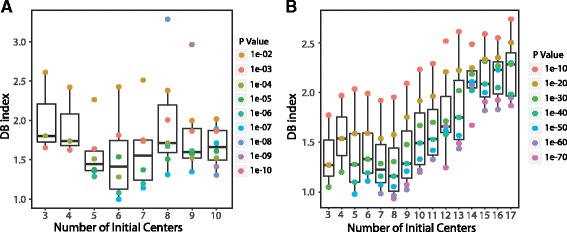
Distribution of DB index values calculated by SAIC algorithm for lung epithelial dataset and cell mixture data set. a DB indexes were calculated for each p value and initial center k combination after the SAIC algorithm converged using the 80 epithelial lung single cell dataset. Boxplot of DB indexes of different p values are shown for each initial center. Each dots represents the DB index value for each p value. b Similarly, DB indexes were calculated using the 301 single cell mixture data set