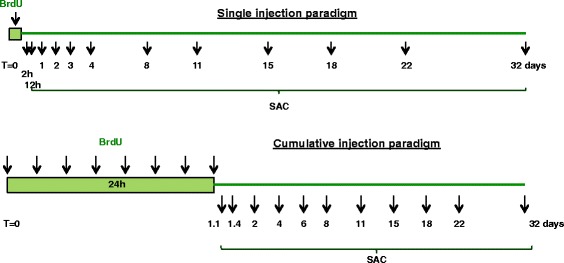
Fig. 3.

Experimental flow-chart of single and cumulative BrdU labeling. Arrows pointing to the green box indicate time points of BrdU injection in two experimental designs, while lower arrows pointing to numbers (hours (h) or days) stand for time points when animals were sacrificed (SAC). For the purpose of modeling and computation, we used single injection paradigm, while data for the apoptotic experiments were derived from the cumulative BrdU paradigm
