
Fig. 9.
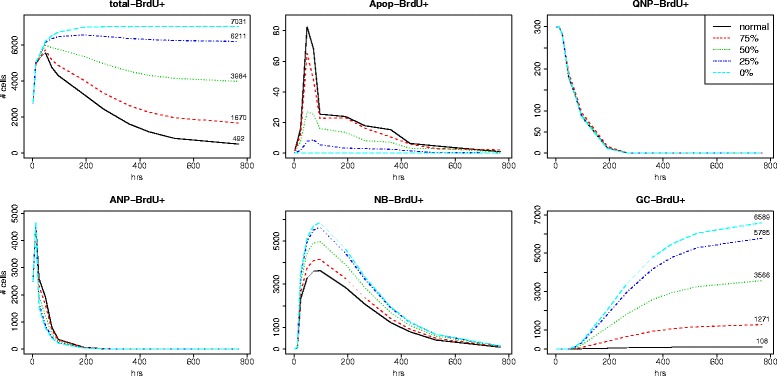
Prediction of dynamics of neurogenesis under reduced apoptosis. Effect of reducing apoptosis on simulated labeling curves of different types of cells over the time course of 32 days. Black line = normal apoptotic rates; red = apoptotic rates reduced to 75% of the normal rates; green = apoptotic rates reduced to 50% of the normal rates; blue = apoptotic rates reduced to 25% of the normal rates; light blue = apoptotic rates reduced to 0%