
Figure 3.
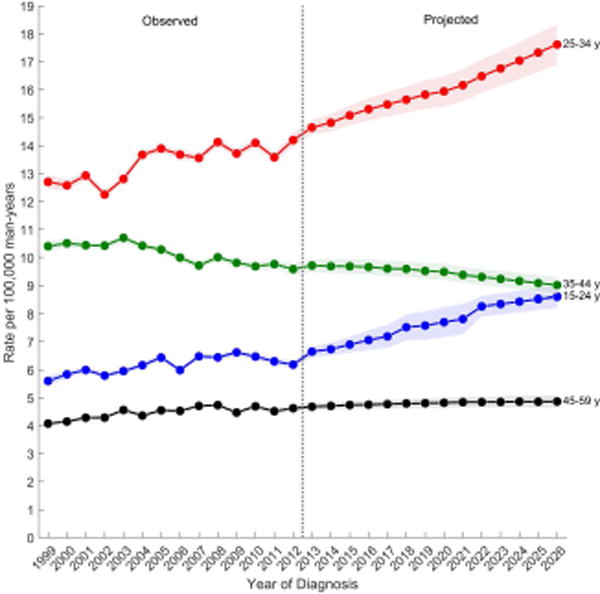
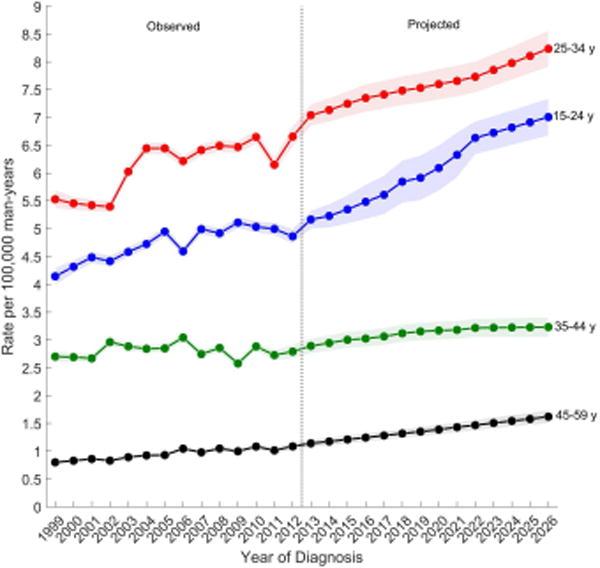
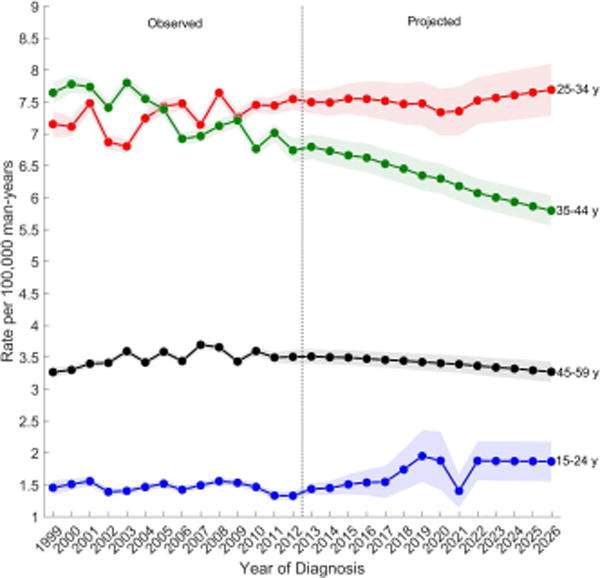
Observed (1999–2012) and projected (2013–2026) age-standardized incidence rates of (a) testicular germ cell tumors, (b) seminomas, (c) nonseminomas by age group, SEER/NPCR Registries. Shaded bands show the 95% confidence interval.
(A) Testicular germ cell tumors
(B) Nonseminomas
(C) Seminomas