| Project planning and engagement (Fig. 1 ) |
| Early engagement with stakeholders for each case study was undertaken to identify a priority problem, and determine and define policy priorities requiring decision support methods. A domain expert, preferably from the primary partner organisation (partner), was identified to be a lead collaborator in the project (lead domain expert). This role included supporting the engagement of stakeholders and co-facilitating workshops. |
| Project planning meetings were held to clearly define the aspects of the problem to be modelled and its scope and boundaries, as well as to identify key outputs of interest and intervention options to be included and tested by the model. |
| Experts and key participants with an important ‘stake’ in the topic were identified and invited to participate in the model development group (participants). Group composition was purposefully considered to ensure inclusion of a diverse range of views and identification of participants who were considered reliable and reputable representatives of broader stakeholder groups (stakeholders). Background reading material regarding simulation modelling and the topic of interest was sent to participants prior to the workshop to provide a platform of common understanding. |
| Model building and validation |
| Through a series of participatory workshops, the model building group, informed by collated evidence and data, collaboratively identified and mapped the key risk factors and likely causal pathways leading to outcomes of interest for the focus topic of the model. |
| The proposed model architecture was presented at the first workshop, and then subsequent versions of the model were developed to reflect participant language, input and feedback as well as providing increased detail and maturity. |
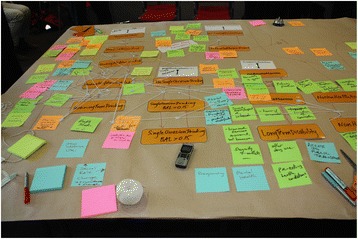
| Participants were familiarised with the model infrastructure using paper-based physical representations. For example, during one activity, participants built a physical representation of the model, with model components represented in card and tape. Participants worked collaboratively to document factors that contribute to the problem being modelled and mapped these directly onto the card and tape representation (Fig. 2). |
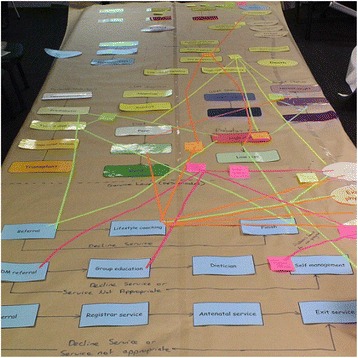
| Similar activities were conducted to involve participants in mapping the mechanisms through which interventions would impact the model (Fig. 3). |
| The interim conceptual map or model was tested and validated in collaboration with the model building group during each workshop. |
| The workshop structure was flexible to account for differences in group size and incorporated a range of activities with the whole group or smaller sub-groups as appropriate to allow participants to raise issues, negotiate perspectives and build consensus. For activities where the group was split, the modelling team allocated participants to ensure each sub-group included a range of perspectives and areas of expertise, and to encourage productive group dynamics. |
| Consensus building for policy actions |
| Final half-day workshops and follow-up webinars were conducted where the model was presented back to the model building group for verification, discussion, consensus, feedback of results and further input on preferred visualisation of model outputs. |
| Outputs from modelled scenarios were presented to participants to facilitate the development of new insights and knowledge about the likely impact of interventions and discussion about potential policy actions. |
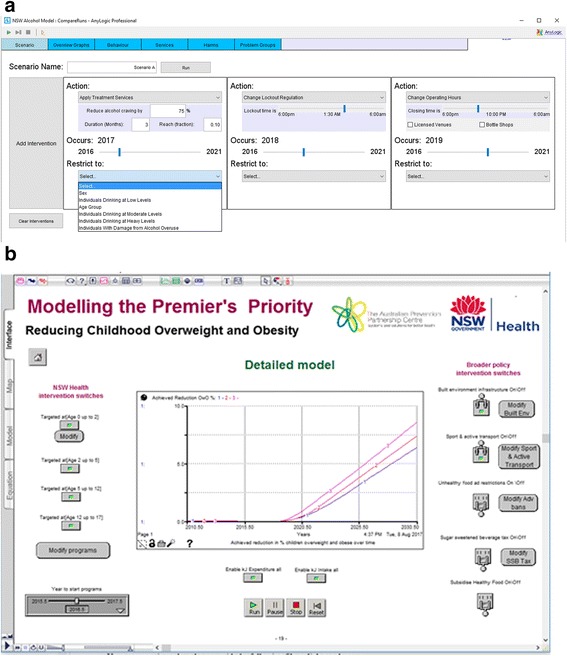
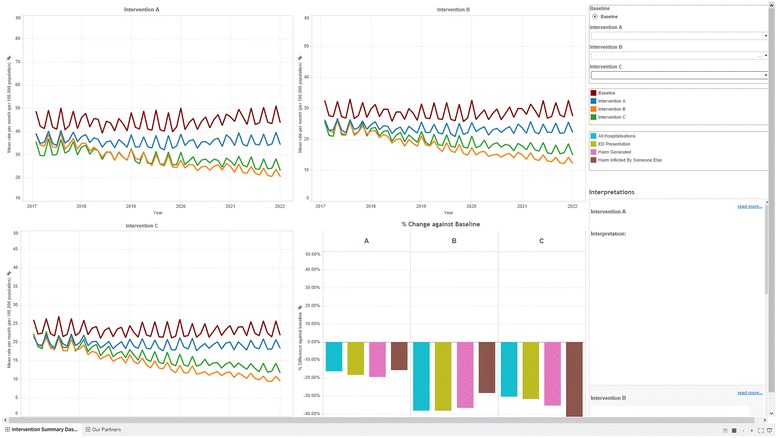
| Examples of the user interface and model outputs are presented in Figs. 4 and 5. These figures illustrate how model users create scenarios to test and compare the outcomes for different combinations of selected interventions. Figure 4 includes the user interfaces from the Alcohol-related harm (top image) and the Premier’s Priority (bottom image) case studies. |
The model outputs take the form of dynamic visualisations and graphs that represent model outcomes for created scenarios, e.g. for variations of intervention effectiveness and reach. These can be compared against benchmark or ‘business as usual’ model outputs. Figure 5 presents example outputs from the Alcohol-related harm case study.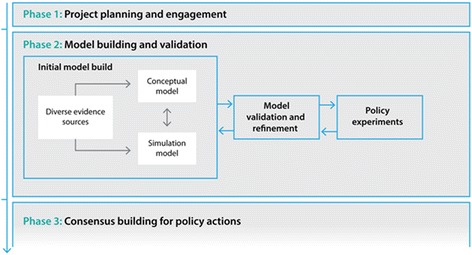
|

An official website of the United States government
Here's how you know
Official websites use .gov
A
.gov website belongs to an official
government organization in the United States.
Secure .gov websites use HTTPS
A lock (
) or https:// means you've safely
connected to the .gov website. Share sensitive
information only on official, secure websites.