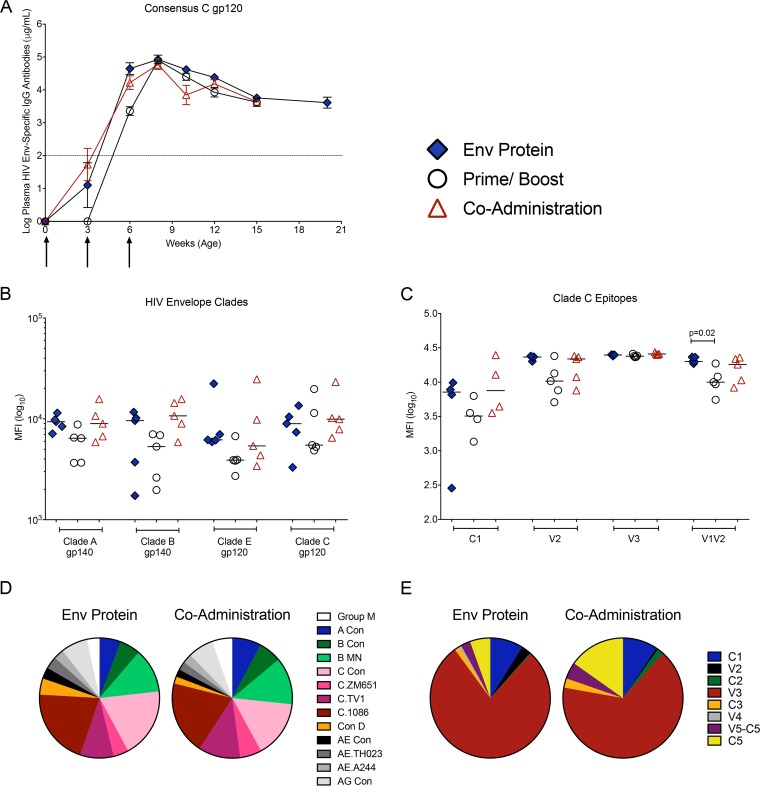
FIG 2.
HIV Env-specific plasma IgG. (A) HIV gp120 consensus C-specific plasma IgG concentrations over time, measured by ELISA, are shown as mean values ± standard errors of the means (SEM). Arrows indicate the times of immunization. The dashed line represents the cutoff for HIV Env-specific IgG concentrations considered positive above the background. (B) Log10 MFI values for plasma IgG specific for clade A or clade B gp140 and clade E and clade C gp120 at peak (week 8, equal to 2 weeks after the 3rd immunization) that were measured by BAMA. (C) Specificities of clade C Env-specific plasma IgG determined at week 8 using BAMA. (D) Pie chart illustrating median signal intensities of IgG that recognize Env proteins from different clades by linear epitope mapping. (E) Pie chart summarizing results of linear epitope mapping of plasma IgG at week 8. Note that we did not perform linear epitope mapping for the prime/boost group because they showed slightly delayed induction of gp120-specific plasma IgG and generally had lower responses in the BAMA assay.

