FIG 3.
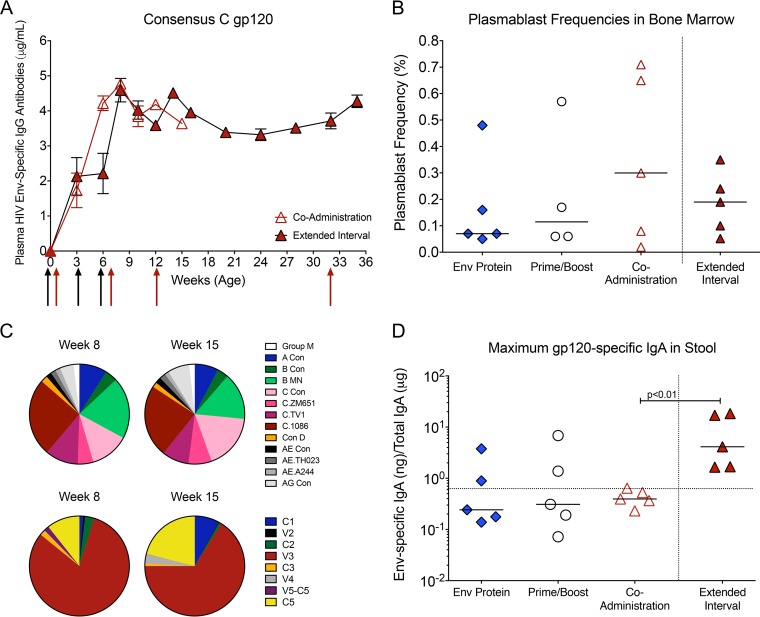
Env-specific antibody responses induced by the extended-interval regimen. (A) Comparison of mean consensus C gp120-specific plasma IgG concentrations in the 3-week accelerated coadministration group and 6-week extended-interval group. Black and red arrows indicate the times when immunizations were performed in the coadministration and extended-interval groups, respectively. (B) Median frequencies of plasmablasts in bone marrow of vaccinated animals at the time of euthanasia. Plasmablast frequencies are reported as percentages of Ki-67+ ICIgG+ cells within the CD20−/int population. (C) Pie charts illustrating the median relative signal intensities of Env proteins of other clades or clade C Env epitopes recognized at weeks 8 and 15 by plasma IgG in animals of the extended-interval group as determined by linear epitope mapping. (D) Specific activities of C.1086 gp120-specific IgA, expressed as nanograms of anti-gp120 IgA per μg of total IgA, in fecal extracts prepared from stool samples. The dotted line indicates the cutoff for samples considered to be positive for C.1086 gp120-specific IgA.

