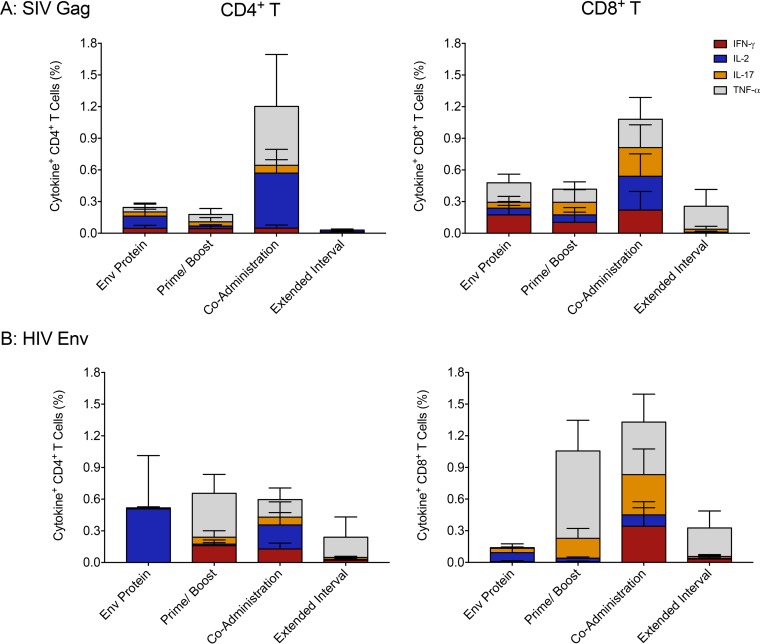
FIG 8.
SIV Gag-specific and HIV Env-specific T cell responses. (A and B) Percentages of SIV Gag or HIV Env-specific CD4+ (left) and CD8+ T cells (right) in mesenteric LNs. Each bar represents the sum of the mean frequencies + SEM of IFN-γ, IL-2, IL-17, or TNF-α single-positive T cells in each group.

