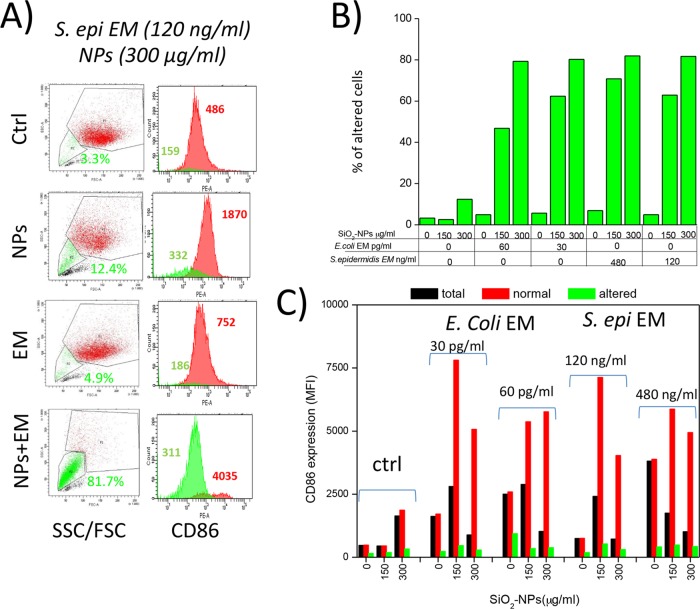
FIG 6.
Synergic induction of a DC population unable to overexpress CD86 by SiO2 NPs and bacterial EMs. (A) Illustrative dot plots and histogram plots of CD86 expression distributions obtained by FACS analysis of DCs treated for 24 h with SiO2 NPs and EMs. Gating, the percentage of anomalous cells (green) with reduced side and forward scattering properties, and their corresponding levels of CD86 expression (indicated as MFI values) are shown. Red histogram plots represent functional DCs with forward scatter (FSC) and side scatter (SSC) parameters similar to those of control (Ctrl) cells; green histogram plots represent anomalous dendritic cells that had forward scatter and side scatter parameter values lower than those of control cells and that were unable to undergo maturation. Data are from 1 representative experiment of 10 experiments conducted. (B) Illustrative histogram plots of the CD86 MFI expressed by dendritic cells after 24 h of incubation with the different stimuli indicated in the figure. Numbers indicate the MFI of the peak. Data represent the percentage of altered DCs (with low forward scatter and side scatter parameter values) after treatment with different NP and EM concentrations. (C) CD86 expression (indicated as MFI values) by total cells (with no gating in dot plots), normal cells (gated by means of their forward scatter and side scatter values similar to those for control cells), and shrunken cells (gated by means of their low forward scatter and side scatter values) after DC treatment (with NPs alone or with different concentrations of EMs). S. epi, S. epidermidis.

