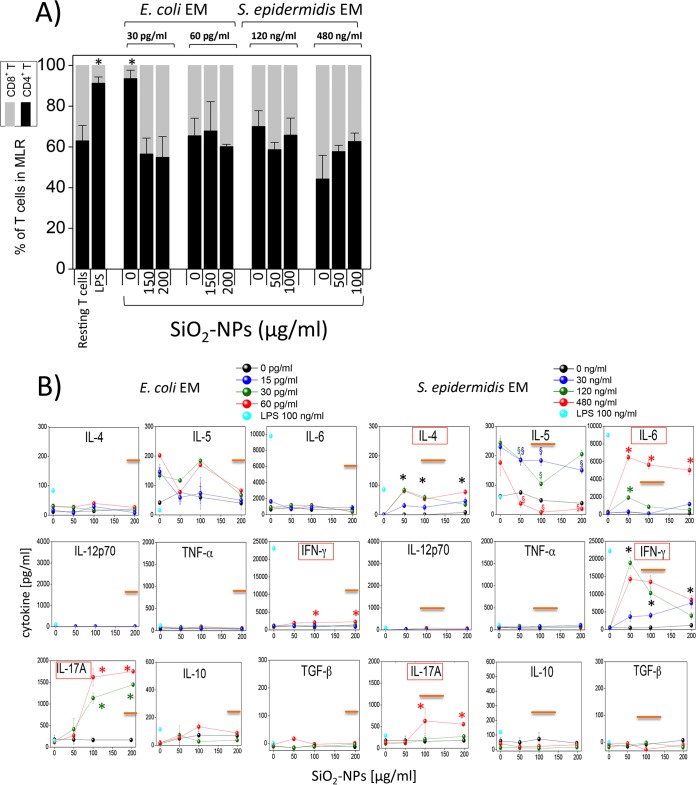
FIG 7.
Percentages of CD4+ and CD8+ cells and cytokine release by allogeneic T lymphocytes mixed with DCs pretreated with SiO2 NPs and bacterial EMs. (A) The relative amounts of CD4+ T cells and CD8+ T cells among resting or DC-induced proliferating lymphocytes after preincubation with LPS or NPs and EMs were determined by FACS analysis using specific antibodies (means ± SEs; n = 4, run in triplicate). *, P < 0.05 with respect to control cells. (B) Relative amounts of cytokines produced by allogeneic T lymphocytes after 5 days of incubation with DCs preincubated for 24 h with SiO2 NPs and bacterial EMs, as indicated. Data are from one representative experiment of four experiments conducted and represent means ± SEs. Black asterisks, P < 0.05 with respect to cells treated with NPs alone for all the EM concentrations used; green or red asterisks, P < 0.05 with respect to cells treated with NPs alone for the indicated concentration of EMs (indicated by the green and red symbols, respectively); green, blue, or red section signs, P < 0.05 with respect to cells treated with NPs alone for the indicated concentration of EMs (indicated by the green, blue, and red symbols, respectively). Orange straight lines, IC50 values; red boxes, induction of cytokine release occurred at concentrations less than the IC50 values.

