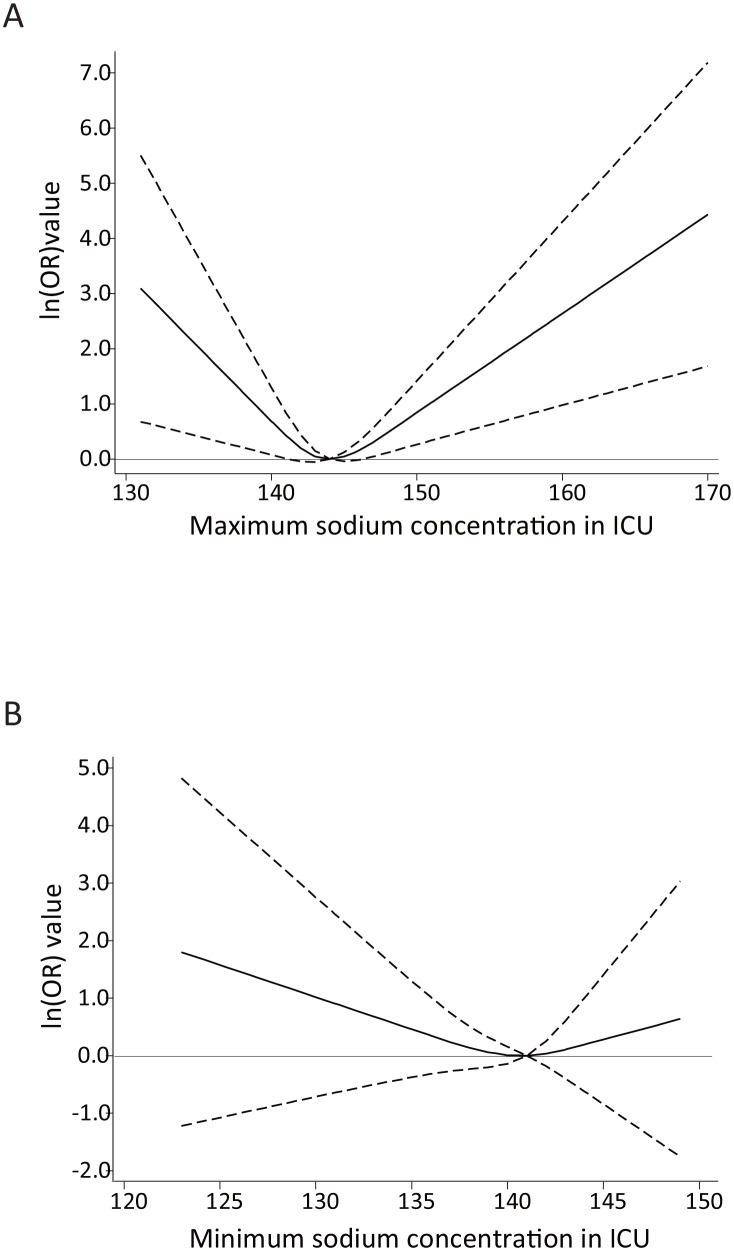
Figure 3.
Association between maximum and minimum sodium concentration and mortality (adjusted OR and 95% CIs) by restricted cubic spline model (three knots) in patients with cerebrovascular diseases. The dashed lines represent the 95% CIs for the spline model. (A) Maximum sodium concentration and 28-day mortality. (Reference: 144 mEq/L) The curve’s nadir was between 141 and 146 mEq/L. (B) Minimum sodium concentration and 28-day mortality. (Reference: 141 mEq/L) The spline curve was not significantly associated with mortality. ICU, intensive care unit.

