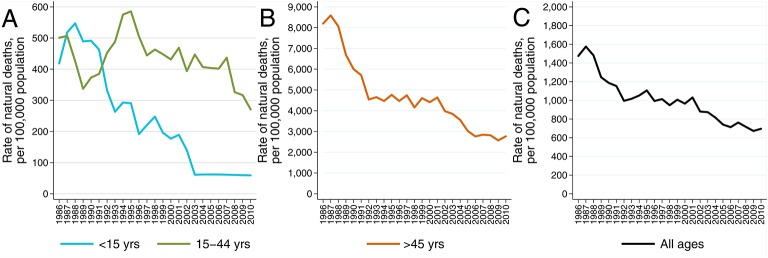
Figure 4.
(A–C) Tiwi rates of natural death per 100 000 population by age group, 1986–2010. Note: The figure presents a 5-year rolling average of natural death rates by age group: <15 and 15–45 years (A); ≥45 years (B); all ages (C). People who started dialysis are included among natural deaths. The low rates of death depicted for those <15 years from 2003 to 2010 are each based upon the average of the very small number of events (four) that occurred between 2001 and 2010. Sources of 1986–2010 population data: quinquennial census estimates (Australian Bureau of Statistics Catalogues: 1987, #2460.0; 1993, #2730.7; 2000, #70609; 2007, #2001.0; 2002, #2002.0; 2012, #2002.0).17

