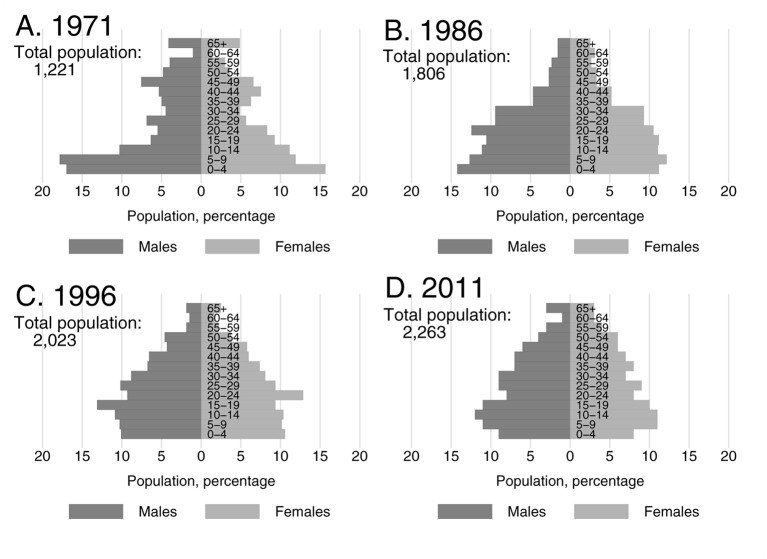
Figure 5.
(A–D) Age distribution of the Tiwi population at four time-points, by sex, 1971–2011. Note: The figure presents population pyramids and total population for 1971 (A), 1986 (B), 1996 (C) and 2011 (D). Sources: (A) cited in Peterson, 198818; (B–D) census data, Australian Bureau of Statistics (Catalogues: 1987, #2460.0; 2000, #70609; 2012,#2002.0).17

