
Fig. 3.
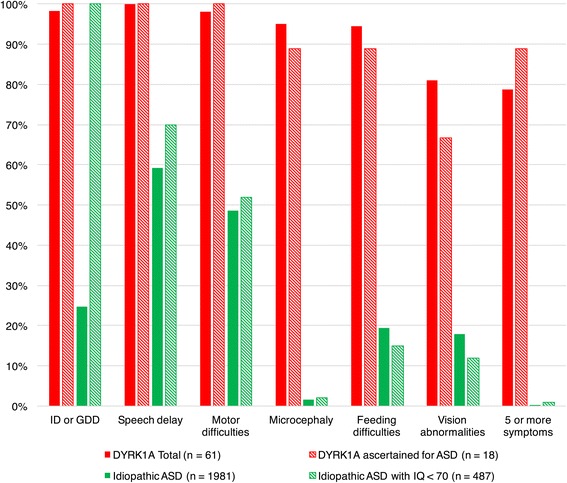
Phenotypic features in total DYRK1A sample, DYRK1A sample ascertained for ASD, and idiopathic ASD samples. Bar graph presented frequencies of core phenotypic features observed in 75% or more of DYRK1A patients. Total DYRK1A sample (Pub-SNV, UW-SNV, Pub-CHR) and DYRK1A sample ascertained for ASD were compared to frequencies of features in idiopathic ASD samples (total and IQ < 70) using Fisher’s exact tests (p < 0.001)