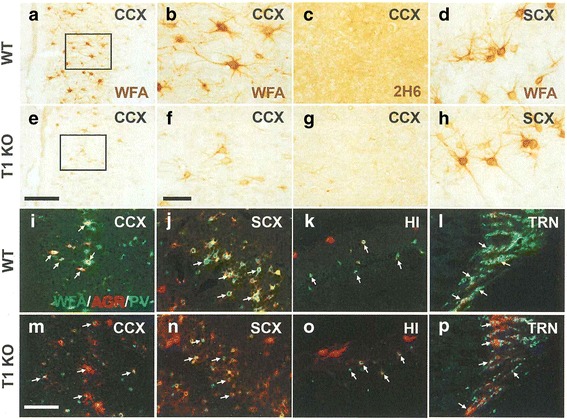
Fig. 2.

Representative views of histochemistry revealed abnormal PNNs but normal PV cells and AGR distribution in various brain regions. a-p DAB staining of CS in the cingulate cortex (CCX; WT; a-c, T1KO; e-g) and in the somatosensory cortex (SCX; WT: d, T1KO: h). b and f are higher magnification views of the rectangular areas in (a) and (e), respectively. CS was labeled with WFA (a, b, d, e, f, h), and directly recognized with an anti-CS antibody, 2H6 (c, g). i-p Triple fluorescent staining with WFA (green), anti-AGR (red), and anti-PV (blue) in the CCX (i, m), SCX (j, n), hippocampus (HI) (k, o), and thalamic reticular nucleus (TRN) (l, p) in the brain obtained from WT (i-l) and T1KO (m-p) mice. Representative PV cells were indicated by white arrows (i-p). Scale bars, 200 μm (a and e), 50 μm (b-d, f-h), and 100 μm (i-p)
