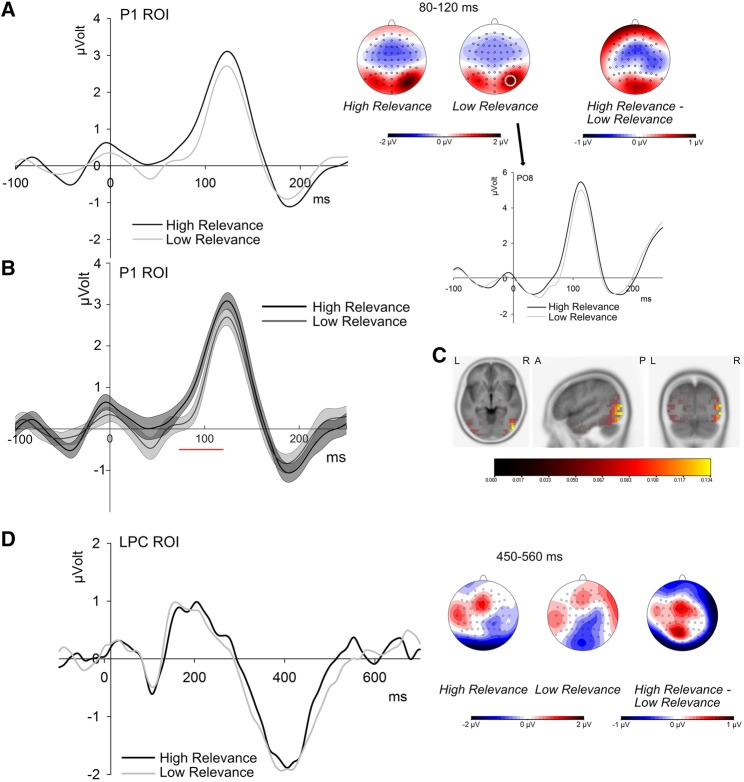
Fig. 2.
ERP effects of personal relevance. A) Grand mean waveforms for high and low personal relevance averaged over P1-ROI electrodes (left) and for electrode PO8 (right). Scalp distributions show both relevance conditions and their difference in the indicated time window. B) ERPs and 95% confidence intervals for high and low relevance, showing a significant difference from 73 to 120 ms after stimulus onset (red). C) Source localizations across all trials in the P1 time window, showing sources in the occipital and temporal lobes. D) Grand mean waveforms for high and low personal relevance averaged over LPC electrodes and scalp distributions of high and low relevance and their difference between 450 and 560 ms.

