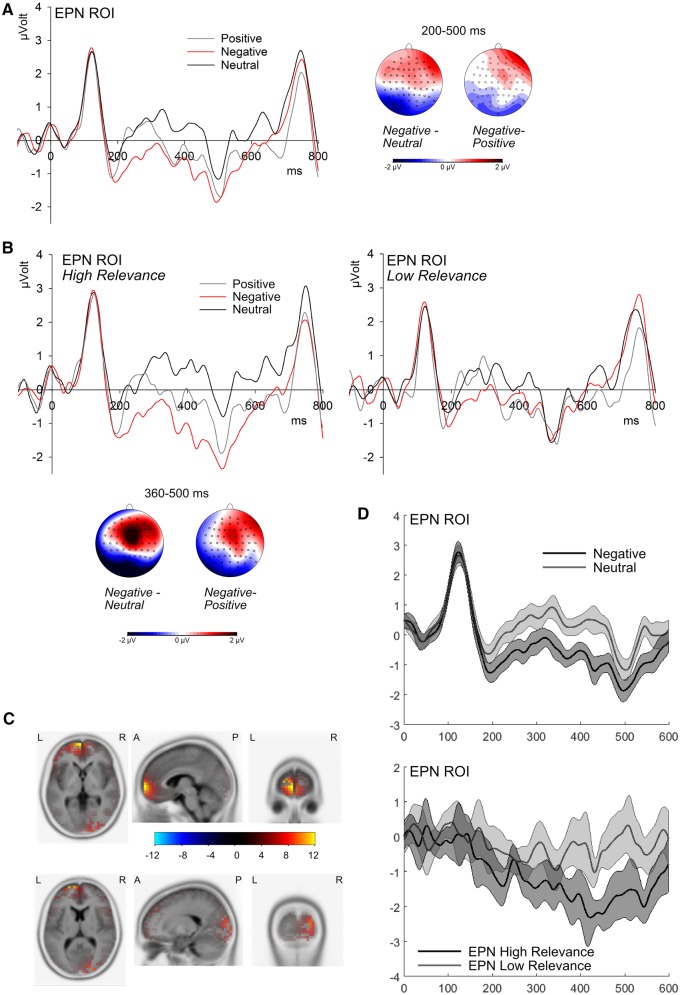
Fig. 3.
ERP effects and source localizations of emotion and personal relevance. A) Grand mean waveforms for emotion categories across relevance conditions. Scalp distributions depict significant emotion effects as differences between indicated emotion categories from 200 to 500 ms. B) Grand mean waveforms for emotion categories, depicted separately for high and low personal relevance. Scalp distributions show difference topographies between indicated emotion categories corresponding to significant emotion effects in the high relevance condition from 360 to 500 ms. C) Results of sLORETA source reconstructions showing maxima of activation in the prefrontal cortex (upper panel, coordinates at max.: x = -5, y = 65, z = 0) and in the visual cortex (lower panel; coordinates at max.: x = 20, y = -95, z = 10); results are corrected for multiple comparisons. D) ERP waveforms and ninety-five percent confidence intervals for negative and neutral critical words (corresponding to the main effect of emotion; upper panel) and for the difference between negative and neutral words in both relevance conditions (depicting the interaction between emotion and personal relevance; lower panel).

