
Table 3.
RMSE of predicting the outcome measures (i.e. BDI, SWLS, PILL and BSI_ANX) using SVMs regression model with a radial basis function (SVM-rbf)
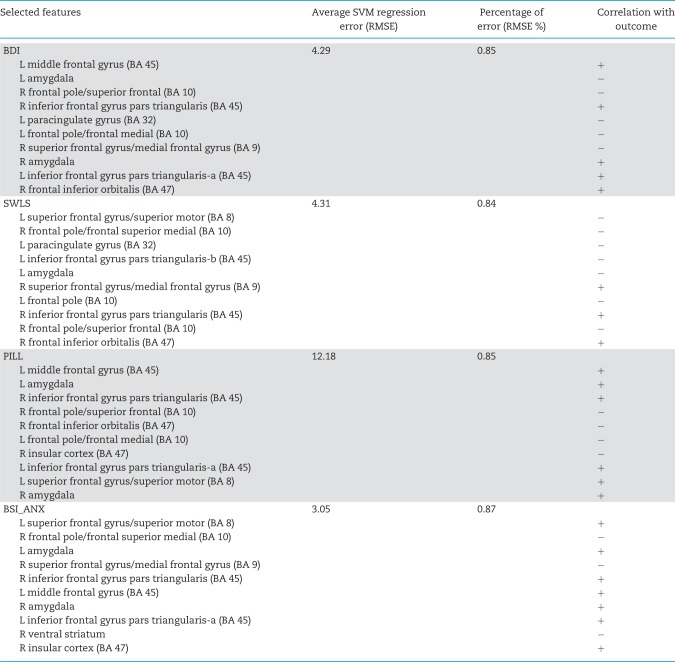 |
The leftmost column lists the top 10 features that resulted in the reported RMSE (specified in the second column). The percentage of average prediction error (RMSE %) calculated from is presented in column three. The fourth column shows the correlation sign for each of those features and the outcome measure. A positive sign of correlation between the predictor and outcome indicates that higher activity in a specific brain region was correlated with improvement in the outcome measure from baseline to 3 month follow-up. L, left; R, right.