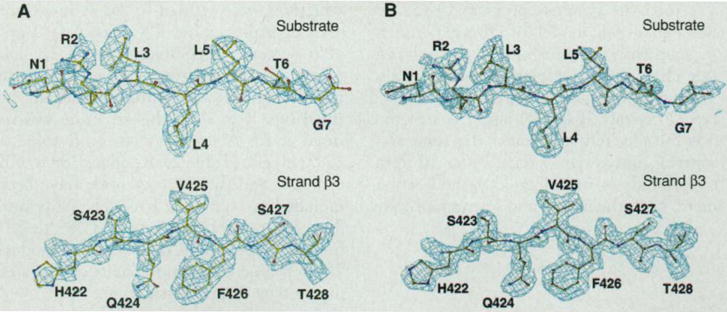
Fig. 1.

Electron density map. (A) The experimental MAD-phased electron density map at 2.3 Å resolution in the separate regions of the substrate peptide and β strand 3 in the protein, contoured at 1σ. Superposed is the refined atomic model. Only the electron density within 5 Å sphere range of the model is shown [with the use of the “mapcover” feature in program O (32)]. The peptide is shown in full length and residues are numbered 1 to 7. Residues 422 to 428 of DnaK in β strand 3 are also labeled. (B) The corresponding 2Fo−Fc electron density map at 2.0 Å resolution, contoured at 1σ, produced by program O (32).
