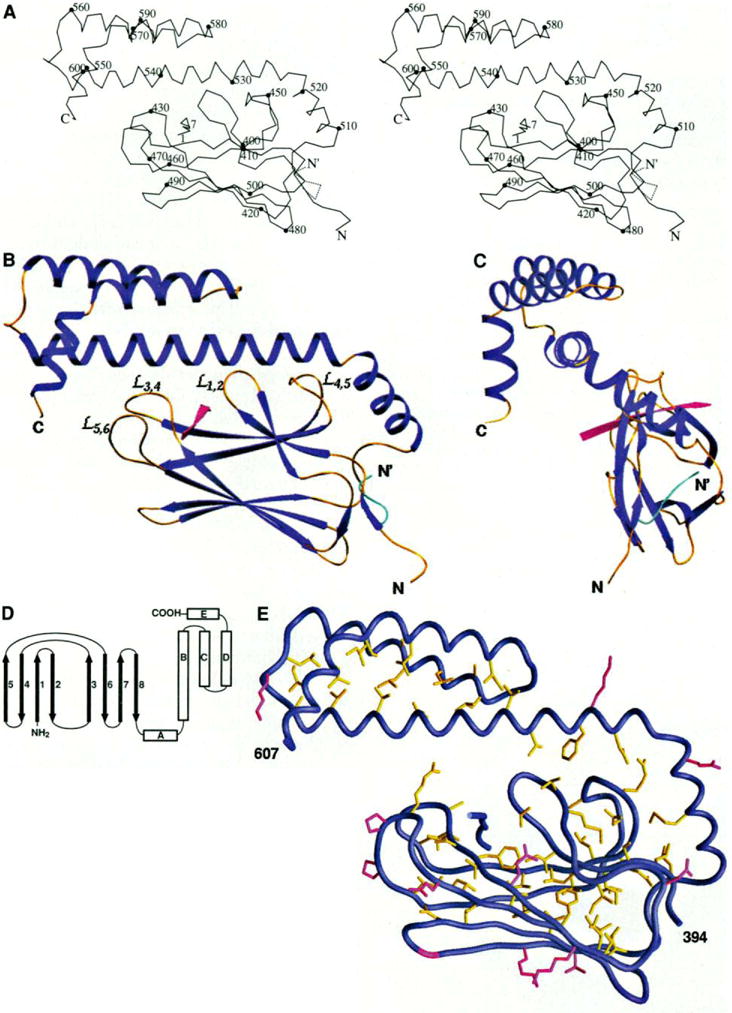
Fig. 2.

Overall structure, (A) Stereo view of a Cα trace of the structure. Every tenth residue is marked with a filled circle and labeled. The alternative conformation of the NH2-terminus from residues 389 to 394 is shown with the dashed line. N and C are the NH2- and COOH-termini of the polypeptide chain, respectively. (B) Ribbon diagram of the structure in the same orientation as in (A), The α helices and β strands are shown in dark blue, the loops in gold yellow, the substrate peptide in red. The alternative conformation of the NH2-terminus is shown in cyan. The bops between the β strands that interact with the helix αB are labeled. (C) A view of the overall structure rotated 90° around the vertical axis from the view in (B). (D) Schematic representation of the topology of the structure. (E) Buried residues and conserved surface residues in the substrate-binding unit of DnaK. The side chains of those residues with less than 10% solvent accessibility are colored yellow. Also, colored in red are the residues that have more than 40% solvent accessible surface and are, as well, identical in E. coli DnaK, bovine hsc70, and hamster BiP (see Fig. 3). Glycines are colored in red for their backbones. [Part (A) produced by MOLSCRIPT (55), (B) and (C) by SETOR (55), and (E) by GRASP (55)]
