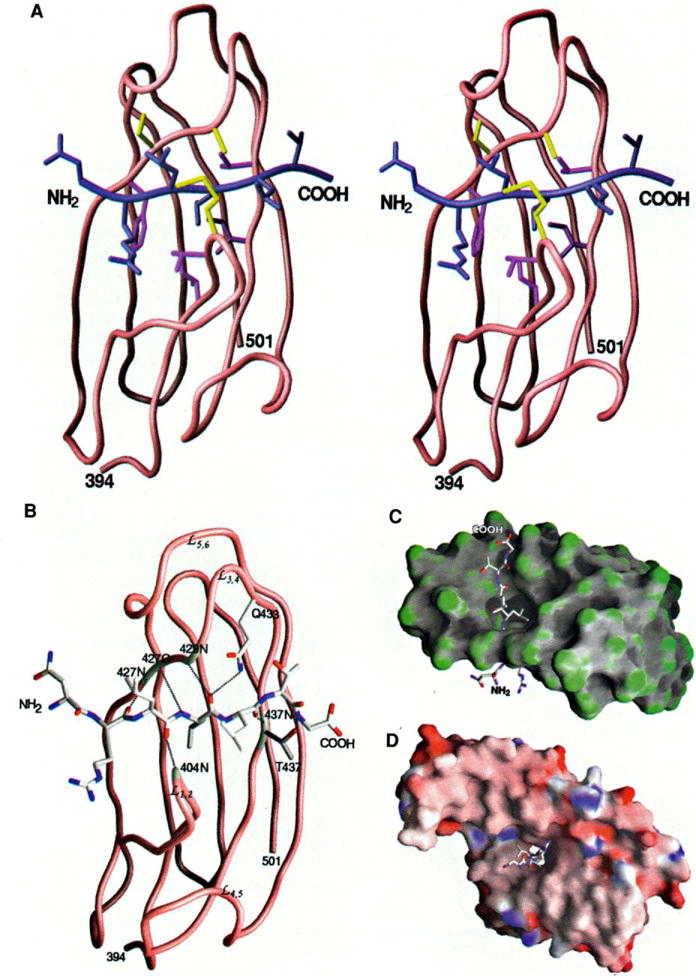
Fig. 4.

Peptide binding to DnaK (A) Stereo view of the interactions of the three leucines in the peptide with the β subdomain. The protein and the peptide backbones are shown in brown and blue, respectively. The DnaK residues interacting with the side chain of Leu4 of the peptide are colored purple and those interacting with Leu3 and Leu5 of the peptide are colored yellow. (B) Hydrogen bonds formed between the peptide and the β-sandwich subdomain of DnaK. The hydrogen bonds are represented by black dashed lines. The residues of DnaK involved in forming the hydrogen bonds are highlighted white. The backbone amide and carbonyl groups interacting with the peptide are labeled. (C) Surface curvature of the p subdomain (residues 394 to 501) bound to the substrate peptide. The most convex parts of the molecular surface are coded green while the most concave and planar are coded gray and white, respectively. This view is as in (A) and (B) but rotated by 90° so that the NH2-terminal end of the peptide is below. (D) Surface electrostatic potential of the substrate-binding fragment of DnaK complex with the peptide. The orientation of the structure is the same as in Fig. 2B; thus, this side is at the NH2-terminal end of the peptide. The surface is colored according to the local electrostatic potential, ranging from dark blue (most positive region) to deep red (most negative). [Parts (A) through (D) produced by GRASP (55)]
