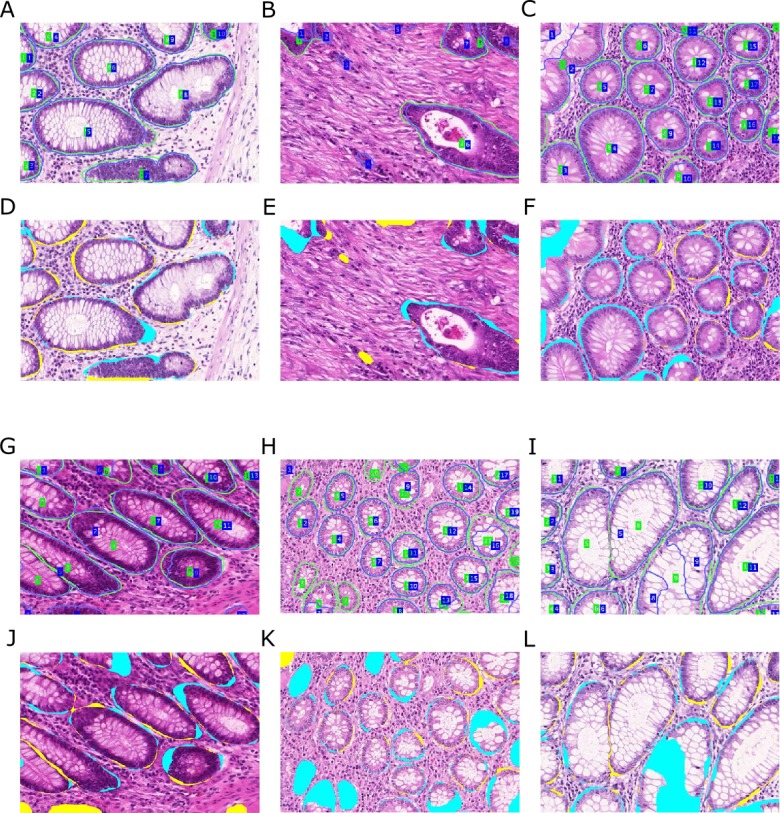
Figure 11. Qualitative segmentation results on images of test dataset A.

Segmentation results are illustrated as blue outlines, ground truth in green (A–C, G–I). Differences to the ground truth are shown in (D–F, J–L), where false negative pixels are cyan, and false positive pixels are yellow. (A–F) depict good segmentation results, while (G–L) show different segmentation errors.
