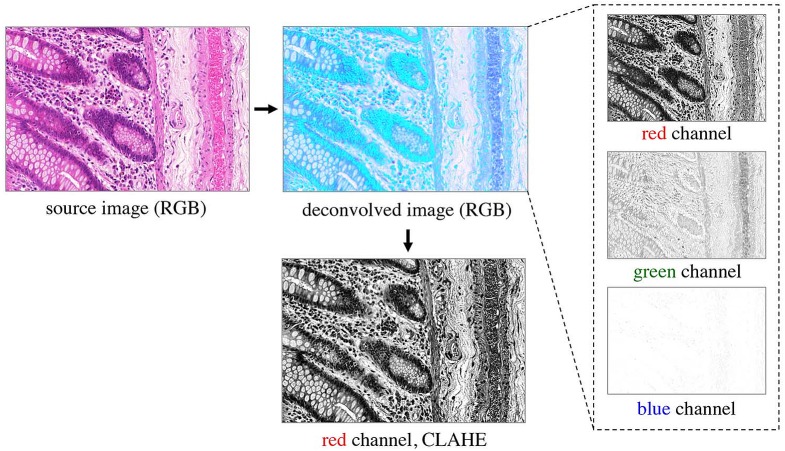
Figure 3. Preprocessing of the RGB images.
Color deconvolution (Ruifrok & Johnston, 2001) separates the H&E stained tissue components. Considering the deconvolved image, the green channel expresses very low contrast, and the blue channel does not contain any relevant information on the tissue structure; both are therefore omitted from further processing. The red channel represents most of the tissue structure. It is processed by CLAHE (Zuiderveld, 1994) and taken as input for the pixel classifiers.

