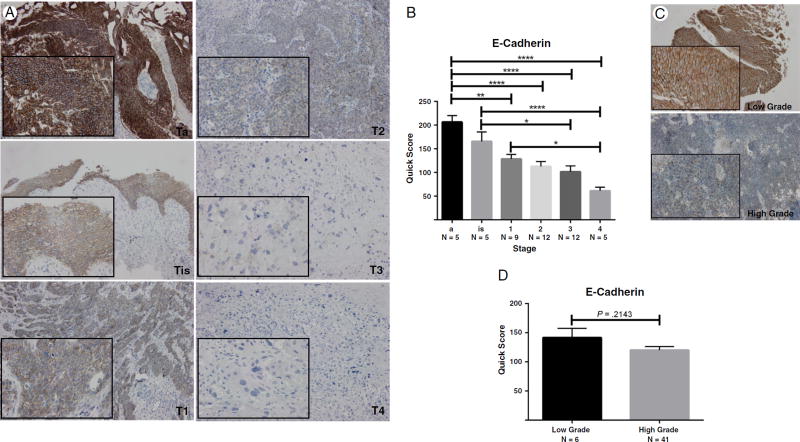
Fig. 2.
E-cadherin expression in human bladder tumors. A, Representative images of immunostaining of human bladder cancer tissue specimens of increasing pathological stage (×100; inset, ×400). B, Quantitative analysis of N-cadherin immunoreactivity by stage. One-way analysis of variance revealed a P value less than .0001; level of significance was set at P < .05. *Values represent mean ± SEM. C and D, Representative images of E-cadherin staining in human bladder cancer specimens by tumor grade with quantitative analysis, respectively.

