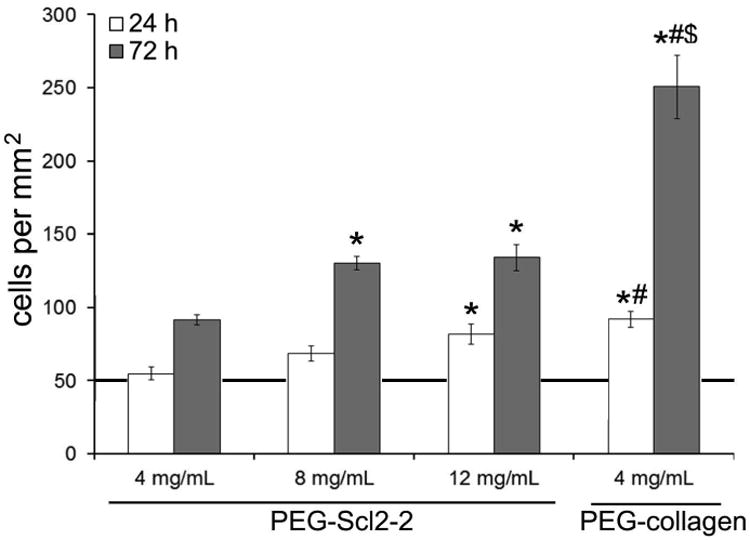
Figure 2.

quantitative assessments of the surface cell density of haecs at 24 h and 72 h. measurements are expressed as mean ± standard error of mean. results were obtained from n = 6 independent samples per formulation with 10 images per sample. the line at 50 cells/mm2 indicates the initial seeding density at time 0. * significantly different from the 4 mg/ml peg-scl2-2 hydrogel, p < 0.05; # significantly different from the 8 mg/ml peg-scl2-2 hydrogel p < 0.05; $ significantly different from the 12 mg/ml peg-scl2-2 hydrogel, p < 0.05.
