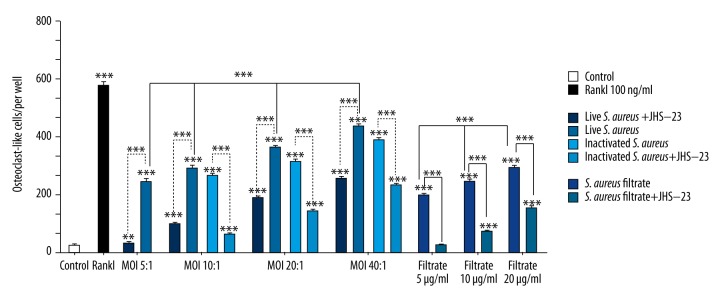
Figure 3.
Results of statistical analysis of osteoclast-like cells in each experimental group. RAW 264.7 cells were treated with live S. aureus, inactivated S. aureus, S. aureus filtrate, JSH-23, RANKL, and PBS for 5 days. Then, the cells were stained for TRAP, and the number of osteoclast-like cells (TRAP-positive and ≥3 nuclei) in every well was counted. Data are shown as means ±SD. One-way ANOVA was used to compared among groups. For the groups with statistical significance, LSD/Student-Newman-Keul test was used to compare the 2 groups, “*” just above the column indicated the comparison with the control group, while the other “*” indicates the comparison between the 2 groups, ** p<0.01, *** P<0.001.

