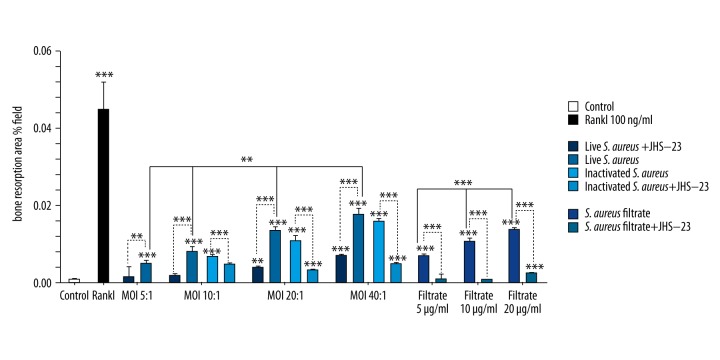
Figure 5.
Results of statistical analysis of resorption pits in each experimental group. RAW 264.7 cells were treated with live S. aureus, inactivated S. aureus, S. aureus filtrate, JSH-23, RANKL, and PBS for 5 days. Then, the cells were removed, and the resorption pits were photographed and analyzed with Scion image software. Data indicated the ratio of the cumulative area of resorption pits divided by the entire image area in the same field of view, and the data are shown as means ±SD. One-way ANOVA was used to compared among groups. For the groups with statistical significance, the LSD/Student-Newman-Keul test was used to compare between the 2 groups. “*” just above the column indicates the comparison with the control group, while other “*” indicates the comparison between the 2 groups, ** p<0.01, *** P<0.001.

