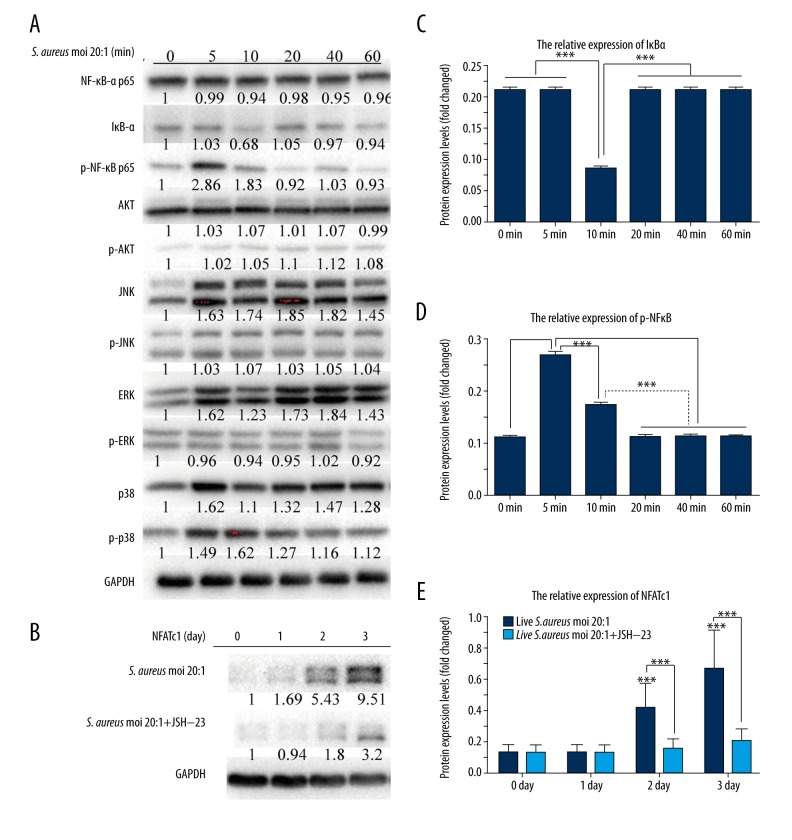
Figure 7.
Effects of S. aureus on the protein expression levels of NF-κB, MAPKs, AKT signaling pathways, and NFATc1. RAW 264.7 cells were treated with live S. aureus at a MOI of 20: 1 for the indicated times (0, 5, 10, 20, 40, and 60 min and 1, 2, and 3 days). Cells were lysed for Western blot analysis with specific antibodies against total ERK1/2, p38, JNK, NF-κB p65, IκB-α, Akt, GAPDH, and NFATc1, or the phosphorylated form of p38, ERK1/2, JNK, Akt, and NF-κB p65. Relative levels of these proteins were quantified by densitometric analysis and normalized to GAPDH. (A) and (B) shows the electrophoresis of the corresponding proteins. (C) Fold changes in IκB-α levels. (D) Fold changes in phospho-NFκB p65 levels. (E) Fold changes in NFATc1 levels. All experiments were performed at least 3 times. “*” just above the column indicates the comparison with 0 day, while other “*” indicates the comparison between the 2 groups, *** P<0.001.

