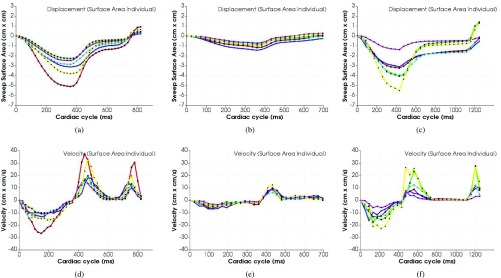
FIGURE 13.
Surface area tracking results for each individual of the 6 segments. (a), (b) and (c) are for surface area; (d), (e) and (f) are for velocity. Different colors of the curves represent the surface area and velocity for the corresponding segments as defined in Figure 6.

