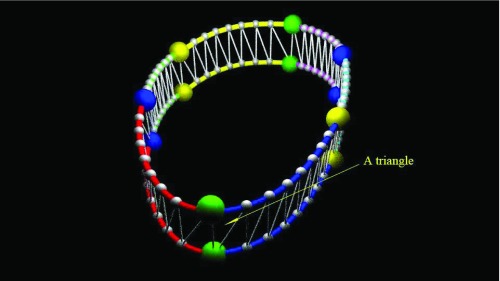
FIGURE 7.
The sweep surface area (SSA) for two subsequent time points, which is defined as the summation of the small triangles as shown in the figure. For each of the 6 splines, we interpolate 7 points. There are totally 48 points. The small triangles are defined based on the interpolated points. The sign of SSA is defined similarly as for the sign of the displacement in single point based tracking: being negative for the systole phase and positive for the diastole phase.

