
Figure 1.
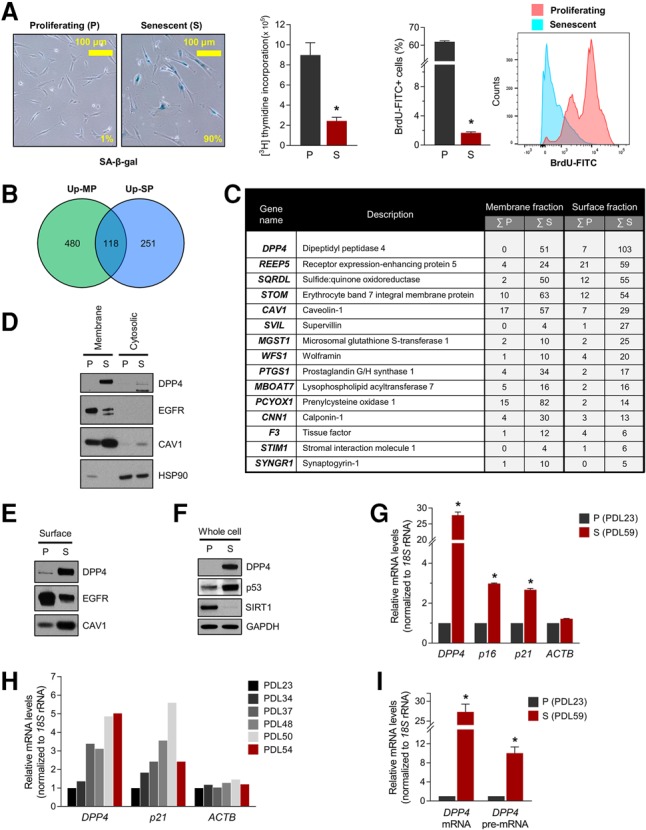
Identification of DPP4 as a novel senescent cell surface marker protein. (A, left) Detection of the senescent marker SA-β-gal in proliferating (P; PDL23) and senescent (S; PDL59) WI-38 HDFs; the percentages of blue cells are indicated. (Middle) Measurement of 3H-thymidine and BrdU incorporation in proliferating and senescent WI-38 cells. (Right) Flow cytometry analysis of BrdU-FITC-positive proliferating and senescent cells. (B) Venn diagram summarizing the MS analysis; the numbers of proteins more abundant in cell membrane preparations (Up-MP; green) and cell surface preparations (Up-SP; blue) from senescent cells relative to proliferating cells are indicated. (C) The top 15 proteins from the intersection in B. The numbers indicate the sums of the PSM from two experiments. (D–F) Western blot analysis of DPP4 levels in membrane and cytosolic lysates (D), surface proteins (E), and whole-cell lysates (F). (HSP90) Cytosolic protein marker; (CAV1 and EGFR) membrane protein markers; (SIRT1) protein marker of proliferating cells; (p53) protein marker of senescent cells; (GAPDH) loading control protein. (G–I) Steady-state levels of DPP4 mRNA and DPP4 pre-mRNA quantified by RT-qPCR analysis. Total RNA was prepared from proliferating and senescent cells (G,I) or cells at PDLs between PDL23 and PDL54 (H). Senescent markers p21 mRNA and p16 mRNAs were included as positive controls, and ACTB mRNA was used as a negative control. mRNA levels were normalized to 18S rRNA levels in each sample; mRNAs in PDL23 cells were set as 1 in G–I. The graphs in A, G, and I represent the means ± SEM from three independent experiments. (*) P-value < 0.05.