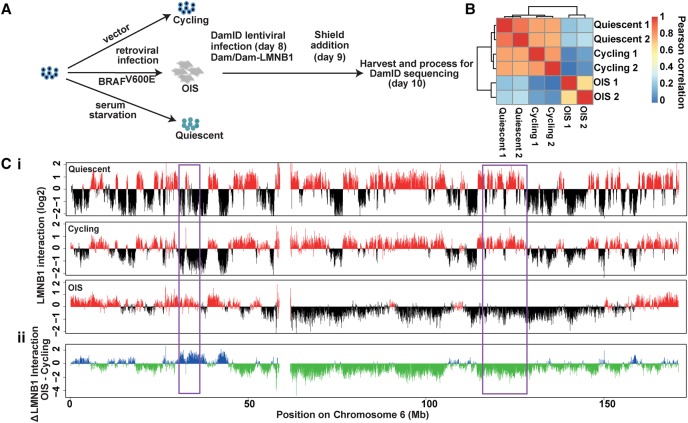
Figure 1.
Massive changes in genome–nuclear lamina interactions occur during OIS. (A) Experimental setup. The time points indicated in the brackets correspond to days after BRAFV600E retroviral transduction or serum starvation. (B) Heat map representation of correlations of Dam-LMNB1 methylation ratios between the two biological replicates each for quiescent, cycling, and OIS cells. (C, i). Genome–NL interaction profile along Chromosome 6 for quiescent cells after 10 d of serum starvation, and cycling and OIS cells 10 d after retroviral transduction. The y-axis represents log2 of Dam-LMNB1 over Dam-only methylation ratio. (ii) Changes in LMNB1 interaction in OIS cells for Chromosome 6. Some regions showing changes in NL interactions are highlighted in purple boxes.

