Figure 2.
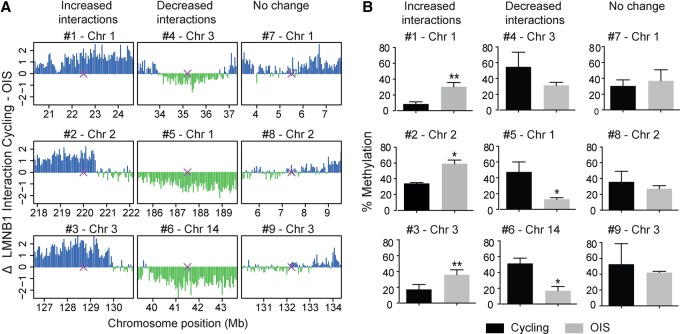
Validation of the changes in NL interactions at individual loci by DpnII assay. (A) Genomic regions showing either increased, decreased, or unchanged NL interactions in OIS cells selected for the DpnII assay. Purple crosses represent the location of the designed PCR primers. (B) Quantification by real-time PCR of Dam-LMNB1-mediated methylation at the loci presented in A in cycling and OIS cells. Results were generated from two independent replicates and are presented as mean ± SD. (*) P < 0.05; (**) P < 0.01, based on a two-tailed paired t-test.

