Figure 4.
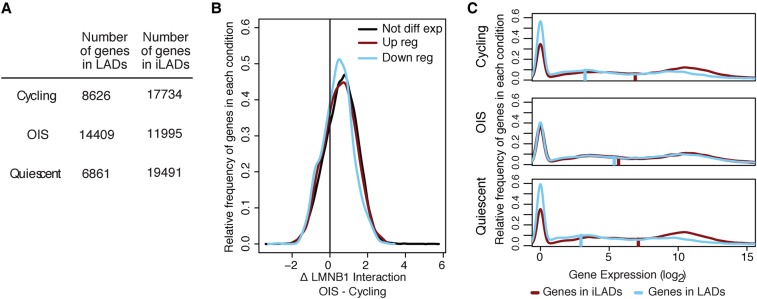
Loss of gene repression at the NL in OIS cells. (A) Quantification of the number of genes in LAD and iLADs in cycling, OIS cells, or quiescent cells. Genes were assigned to LAD or iLAD based on which state their transcription start site fell into for each cell condition. For each cell type, a small number of genes fell into regions we were unable to assign a state to; those genes were censored. (B) Distribution of log2 fold change in LMNB1 binding for genes showing up-regulation, down-regulation, or unchanged expression in OIS cells. Genes were considered not differentially expressed if they had an expression fold change <1 on a log2 scale. Genes were differentially expressed if they had a fold change >2 on a log2 scale and an adjusted P-value <0.05. (C) Density plots of expression levels of genes located within LADs or in inter-LADs (iLADs) in cycling, OIS cells, or quiescent cells. Gene expression data in the different conditions were obtained by RNA-sequencing (at day 10 post BRAFV600E retroviral introduction or serum starvation). The vertical bars on each plot represent the median gene expression level of each condition.

