Figure 5.
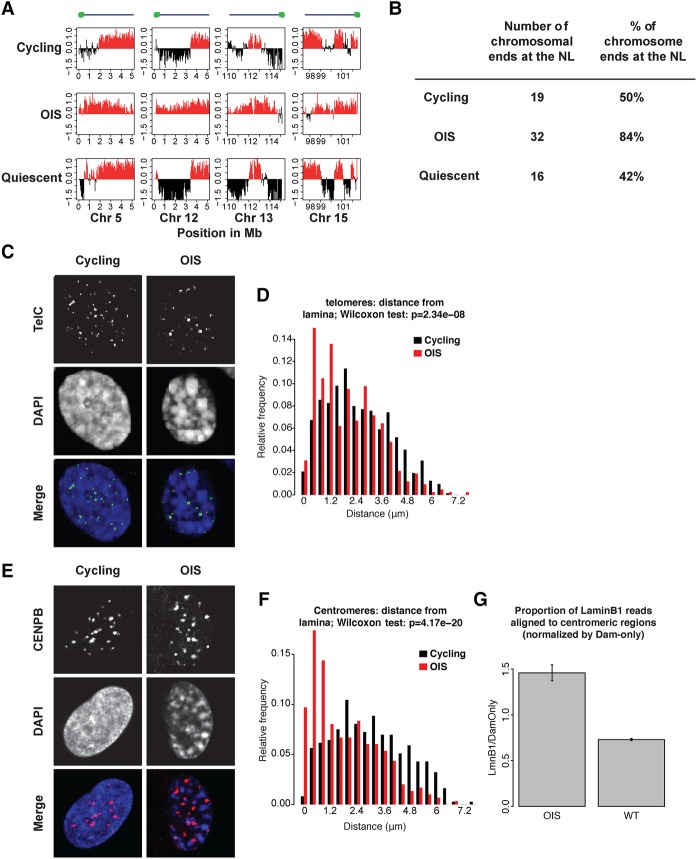
Telomeric and centromeric regions shift toward the NL in OIS cells. (A) Increased nuclear lamina association of chromosomal ends in OIS cells compared to cycling and quiescent cells in the 2-Mb region closest to the end of the chromosome. The y-axis shows log2 Lamin B1 binding ratio for each graph. (B) Quantification of the frequency of interaction of chromosomal extremities as defined in A in cycling, OIS, and quiescent cells. Only the 38 chromosome ends for which a sequence assembly is available were analyzed. (C) Single z-section example of confocal images of cycling and OIS cells stained by FISH with a telomere probe (FITC, grayscale). DNA was stained with DAPI. (D) Distribution of distances of telomere signals to the NL in cycling and OIS cells. Data are from two independent experiments. Number of nuclei counted: 59 (OIS), 61 (cycling); total number of telomere signals counted: 417 (OIS), 740 (cycling). The difference in the distribution of the telomere distance between cycling and OIS cells was statistically significant (P-value = 2.34 × 10⁻⁸, Wilcoxon test). (E) Centromeres labeled with a CENP-B antibody (Alexa Fluor-568, grayscale). Single z-section examples of confocal images are shown. DNA was stained with DAPI. (F) Distribution of centromeres determined as in D. Number of nuclei counted: 55 (OIS), 49 (cycling); total number of centromere signals counted: 299 (OIS), 373 (cycling). The distributions differ statistically significantly (P-value = 4.17 × 10⁻²⁰, Wilcoxon test). (G) Average DamID signals in centromere-proximal regions are stronger in OIS cells compared to cycling cells (P = 0.0067, Welch two-sample t-test; data based on two independent DamID experiments).

