Figure 3.
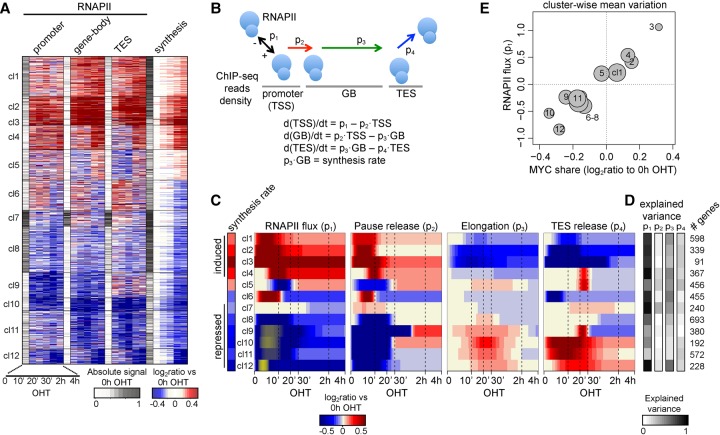
Dynamics of RNAPII loading and progression along transcriptional units. (A) Clusters grouping genes with similar modulation of RNAPII density (change in ChIP-seq reads within various portions of the transcriptional units) and synthesis rate; for each data type, the first column (white to gray) indicates the normalized intensity of the feature in the untreated condition, while the other columns indicate the up- (red) or down- (blue) modulation as the log2 ratio to the untreated condition. (B) The model used to describe progression of RNAPII through the transcriptional units. p1 is the flux of polymerase into the promoter region, p2 is the rate of release from promoter, p3 the elongation rate, and p4 the rate of release from the TES. Model parameters were inferred from the variation of RNAPII density over time within the promoter, gene-body, and TES, respectively. The net amount of RNAPII within each region of a gene was assumed to result from its entry from the preceding compartment and its exit to the next one—the compartment before the promoter and after the TES being the nucleoplasm. (C) Heat map of the changes in p1–4 for each cluster (rows), determined as the log2 ratio to the untreated condition (red for increase, and blue for decrease). Yellow for p1 marks negative parameter values, i.e., loss of RNAPII from the promoters. (D) For each cluster, the explained variance of a model where only that parameter can vary over time is displayed, indicating the ability to recapitulate the changes in RNAPII binding and synthesis rate; the number of genes is indicated on the right. (E) Variation of MYC share at promoters (x-axis, determined for each cluster as the average change at 10 min–4 h OHT compared to the untreated condition) versus the variation of the RNAPII flux (y-axis, at 4 h OHT); the size of the circle is proportional to the number of genes within the cluster.

