
Figure 1.
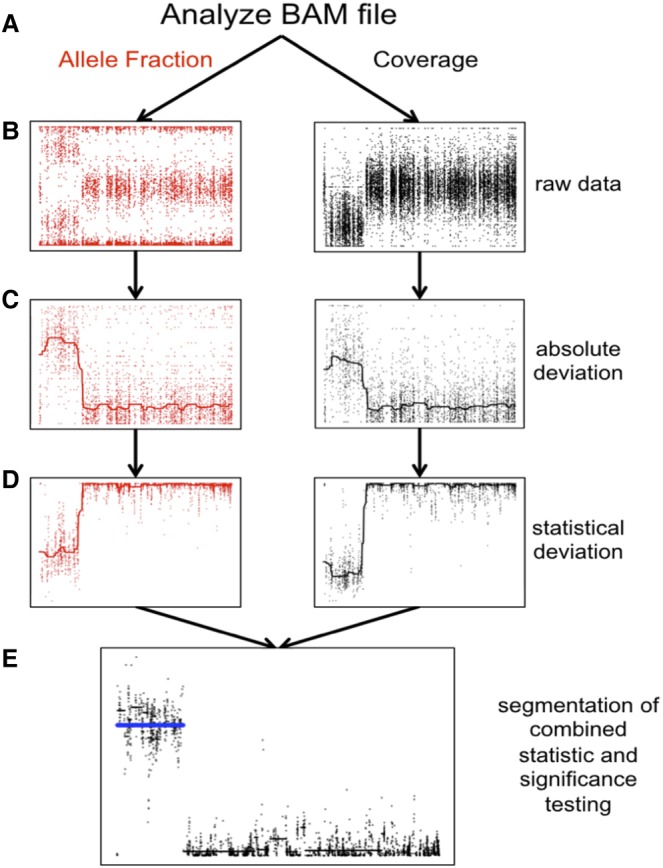
Detecting structural mosaicism using MrMosaic. (A) Exome data are stored in a BAM file from which allele fraction (left) and coverage (right) are measured at polymorphic positions within or near target regions. A simulated mosaic deletion is depicted. (B) The raw data, consisting of BAFs (y-axis: B allele frequency) and normalized coverage (y-axis: log ratio of normalized coverage) are plotted across chromosome space (x-axis) for a simulated mosaic deletion. (C) Absolute deviation of BAF (y-axis: Bdev) and normalized coverage (y-axis: Cdev) at heterozygous sites are analyzed. A smoothed median has been included. (D) Mann-Whitney U tests were performed separately for Bdev and Cdev, comparing the signal detected in sliding windows in this chromosome compared with randomly selected sites from other chromosomes, generating a test statistic (y-axis). A smoothed median has been included. (E) The test statistics are depicted in log scale. The P-values of the Mann-Whitney U tests were combined and segmented (black lines). Segments passing the Mscore significance threshold are plotted in blue.