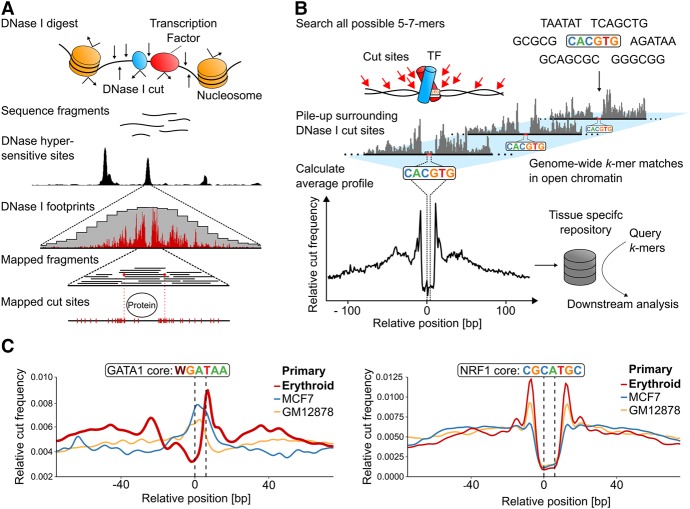
Figure 1.
Generation of k-mer-based, genome-wide average footprints. (A) The principle of generating the digital DNase I footprints occurring in a single genomic location. Exposure of nuclei to DNase I causes frequent double cuts in open chromatin regions, releasing small fragments that can be identified by sequencing. Deep sequencing allows for high-density mapping of the ends of these fragments, which represents the DNase I digestion points and reveals positions protected by TF binding. (B) Sasquatch overview. Genome-wide cut frequency profiles are piled up over all occurrences of all possible short sequences (k-mers) within DNase I hypersensitive sites. For k-mers associated with TF binding, the resulting average cut frequency profiles display average footprints characterized by a cut-depleted center flanked by shoulders of enriched cut frequency. (C) Average profiles reflect tissue specificity of TF footprints as demonstrated by an erythroid-specific TF GATA1 and by a ubiquitous TF NRF1. Average cut profiles were calculated from DNase-seq of primary erythroid, breast cancer (MCF-7), and B-lymphocyte cells (GM12878). The highlighted dotted black lines indicate the location of the motif within the footprint.

