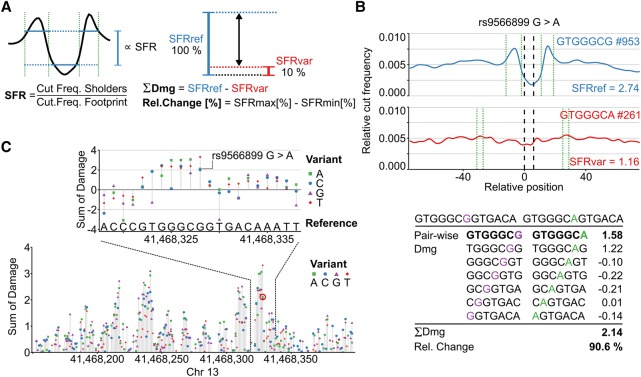
Figure 2.
Predicting the damage potential of single nucleotide variants. (A) The average footprint strength is quantified by calculating the shoulder-to-footprint ratio (SFR). The damaging potential (Dmg) is quantified as the difference between the reference and the variant SFR and also expressed as the relative change (Rel. Change) in footprint strength with respect to the higher SFR. (B) The damaging potential of a SNP, for example, rs9566899, is then assessed by summing the pairwise damage using a sliding window (shown below). The average profiles of the highest scoring k-mer pair are plotted (blue = reference, red = variant). Green dotted lines bracket the automatically detected shoulder regions. The number of occurrences of the respective k-mer within DHSs is indicated by #. (C) Illustration of extending the approach to perform in silico mutation by predicting the impact of every possible mutation at every position in a region of interest. The resulting in silico mutation plots highlight potentially severe mutations and reveal sequences associated with strong TF binding potential in an unbiased and tissue-specific manner. The rs9566899 A allele is indicated (red circle in lower plot).

