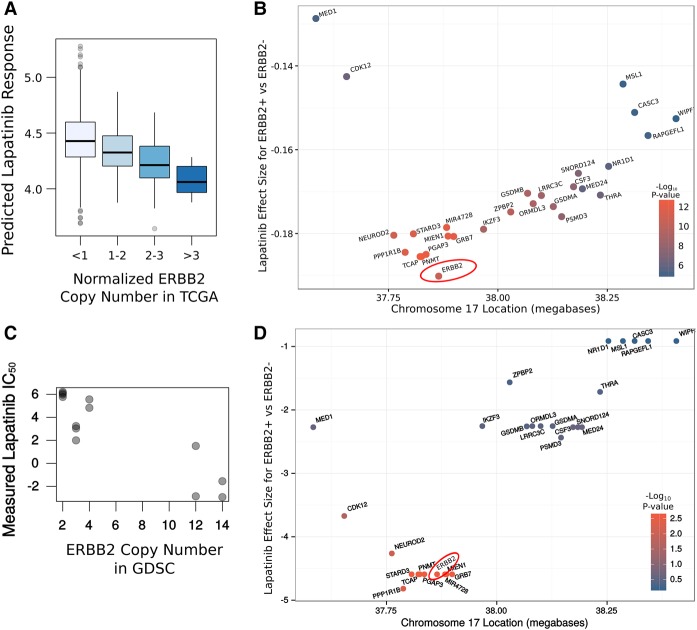
Figure 3.
Association between copy number amplification and lapatinib response for genes in ERBB2 amplicon. (A) Boxplot of association of ERBB2 amplification and imputed lapatinib sensitivity. (B) Each gene was tested for its association between copy number amplification and imputed lapatinib response in the TCGA breast cancer cohort (n = 1089). The resulting effect size is plotted for each gene in the ERBB2 amplicon (on Chr17q12). The biggest effect size is for ERBB2, the known causative gene, suggesting that IDWAS can be used to identify genomic predictors of drug response. Lower values on the y-axis imply greater lapatinib response in copy number–amplified samples. (C) Scatterplot of the measured lapatinib response in GDSC (P = 2.7 × 10⁻³ for the association of ERBB2 amplification and lapatinib IC50 in the GDSC breast cancer cell lines; n = 13). (D) Similar to B, but for the ERBB2 amplicon in the GDSC cell lines. ERBB2 is not easily identified as the causative gene; indeed, eight genes have a P-value as low as ERBB2, and nine genes have an effect size that is as low or lower.

