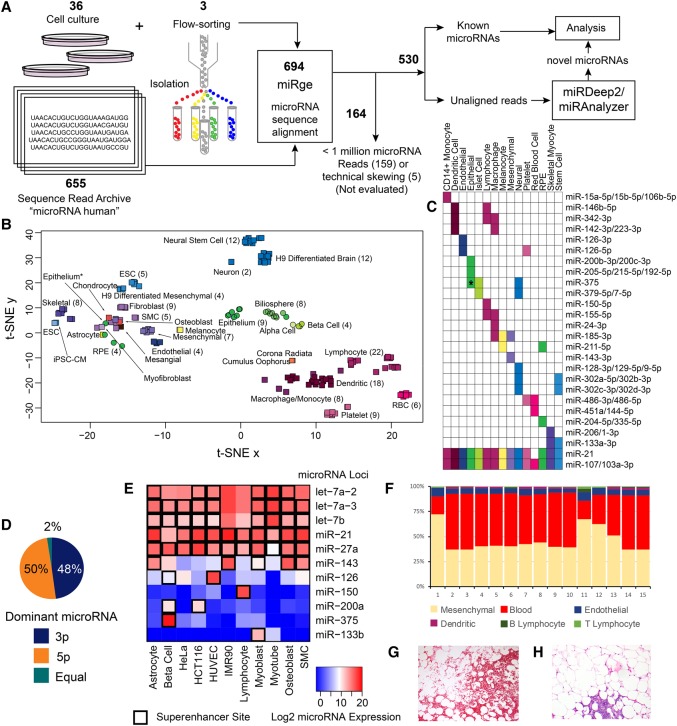
Figure 2.
Method and primary analysis of the cellular distribution of microRNAs. (A) Six hundred ninety-four total samples were processed through miRge, yielding 530 samples available for analysis and novel microRNA detection through miRDeep2 and miRanalyzer. (B) t-SNE distribution of 161 primary cells showing four main clusters (hematologic, epithelial, mesenchymal, and neural/stem cell) and subclustering by cell type. Cell types are color-coded, and round symbols indicate epithelial cells. (*) indicates an intestinal epithelial cell that was either contaminated or underwent mesenchymal transformation. (C) A selection of microRNAs that have unique expression to certain primary cell types. (*) indicates specificity for flow-sorted colonic epithelial (likely goblet) cells. (D) Across 334 microRNAs with >1000 RPM, both strands of a hairpin microRNA give rise to the dominant microRNA in fairly equal measures. (E) The presence of nearby superenhancers strongly correlates with high microRNA expression. (F) The individual cellular microRNA patterns can be used to de-convolute the cellular composition of tissue. (G) A representative hematoxylin & eosin (H&E) section of adipose with significant red blood cells (lower part of the panel) as an example of heterogeneous elements that can contribute microRNA expression (10× original magnification). (H) A H&E representative section of adipose with a small cluster of lymphocytes (lower part of the panel) that may be randomly sampled, modulating the tissue signal (10× original magnification).

