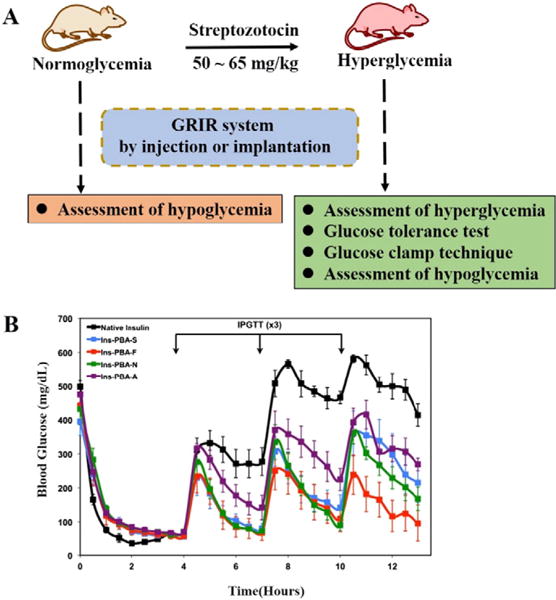
Fig. 4.

(A) Schematic illustration for in vivo GRIR tests including the assessment of hyperglycemia, glucose tolerance test, glucose clamp technique, and assessment of hypoglycemia. (B) In vivo screening of PBA-modified insulin derivatives in an STZ-induced diabetic mouse model. Insulin derivatives or native insulin were injected at the beginning of the experiment (0 h), with a series of IPGTTs performed at 4, 7, and 10 h following the insulin administration. Blood glucose from peripheral tail vein puncture was monitored throughout the study to evaluate GRIR activity (from ref. [70]).
