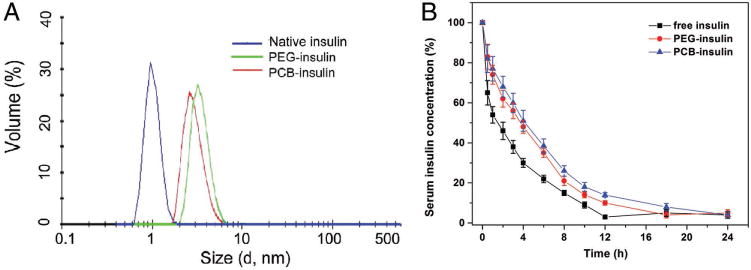
Figure 2.

A) Hydrodynamic sizes for free insulin, PEG–insulin, and PCB–insulin, respectively, as measured by DLS. Samples were dissolved in 0.2 M pH8.4 HEPES buffer. B) The serum insulin concentration as a function of time after the tail vein injection of free insulin, PEG–insulin, and PCB–insulin, respectively. The data are presented as the percentage of the initial values of serum insulin concentration over time ± standard deviation (n = 6).
