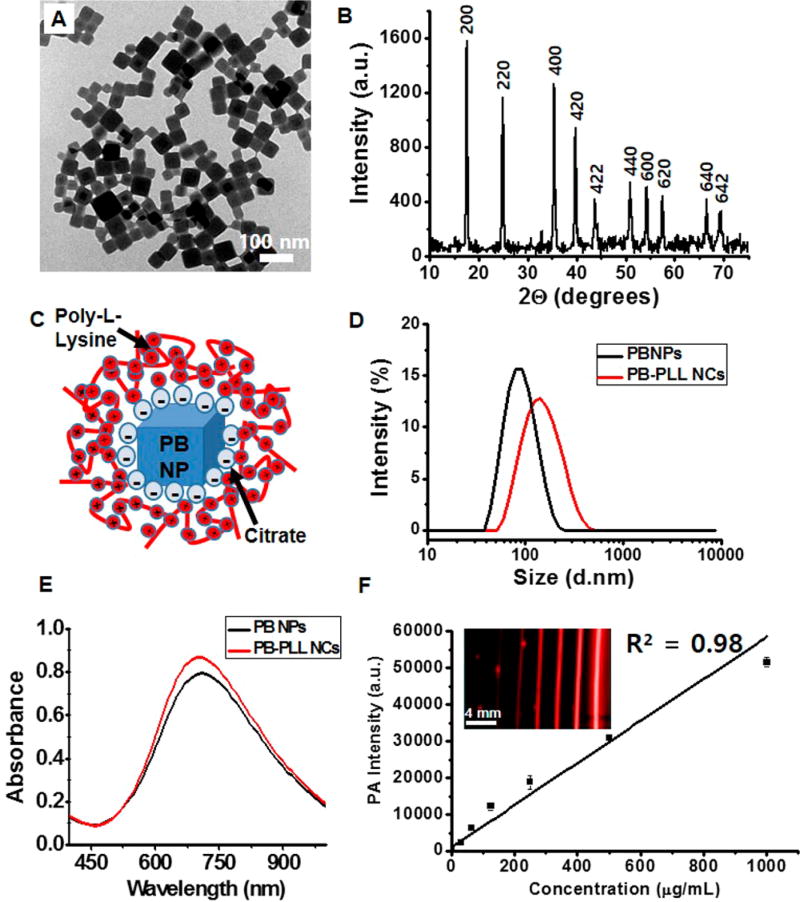
Figure 1. Physical and spectral characterization of the nanoparticles.
(A) TEM images of PBNPs. Scale bar is 100 nm. (B) X-ray diffraction patterns of PBNPs with characteristic peaks assigned to the (200), (220), (400), (420), (422), (440), (600), (620), (640), and (642) planes of face-centered-cubic lattice Prussian blue (JCPDS 73-0687). (C) Schematic representation of PB-PLL nanocomplexes. Negatively charged, citrate-stabilized PBNPs are electrostatically complexed with positively charged PLL. (D) Dynamic light scattering measurements of PBNPs and PB-PLL nanocomplexes. Hydrodynamic diameters of PBNPs (black trace line) and PB-PLL nanocomplexes (red trace line) were 83.36 nm (PDI: 0.11) and 133.8 nm (PDI: 0.14), respectively. Data are presented as relative intensity measurements. (E) UV/visible absorbance measurements of PBNPs (black trace line) and PB-PLL nanocomplexes (red trace line). (F) Plot of the photoacoustic amplitude with increasing concentrations of the solution of PB-PLL nanocomplexs (0, 31.3, 62.5, 125, 250, 500, 1000 µg/mL). The inset shows the corresponding photoacoustic images for the plot. Error bars represent the standard deviation.

