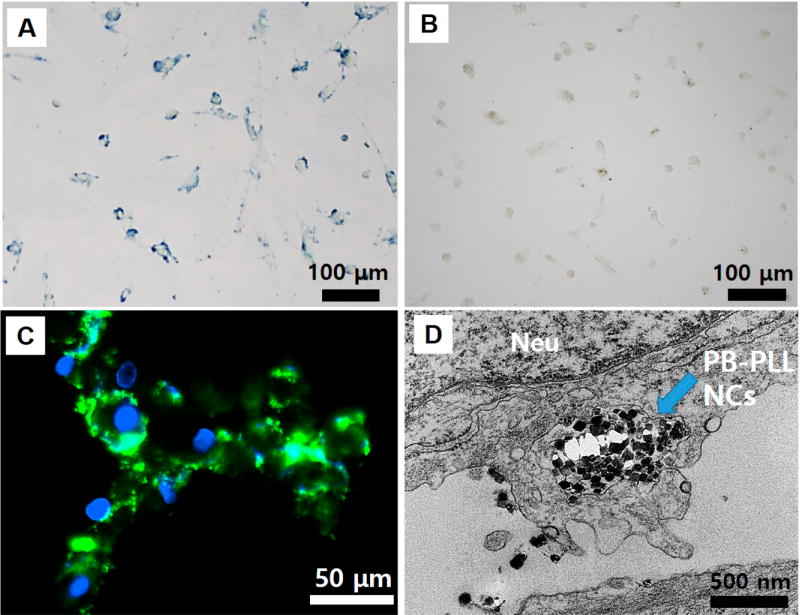
Figure 2. Microcopy analysis to confirm cell labeling.
(A) Bright field microscopy images of hMSCs incubated with PB-PLL nanocomplexes. Scale bar is 100 µm. (B) Bright field microscopy images of hMSCs incubated with naked, citrate-stabilized PBNPs. Scale bar is 100 µm. (C) Fluorescence microscopy images of labeled hMSCs (green: PB-PLL (FITC) nanocomplexes; blue: DAPI-stained nuclei). Scale bar is 50 µm. (D) TEM images of labeled hMSCs. The intracellularly labeled PB-PLL nanocomplexes are indicated by blue arrows in the images. Neu indicates nucleus. Scale bar is 500 nm.

